


INTRODUCTION
Osteoporosis is one of the main health and economic burdens faced by the elderly.[1] The elderly population is increasing globally, leading to various health-related problems.[2] Osteoporosis has no symptoms or signs; therefore, physicians and patients cannot detect this condition themselves in its early stages. If osteoporosis is left without treatment, fragility fractures are the most serious consequences, which can lead to morbidity or mortality.
The gold standard for osteoporosis diagnosis is dual energy X-ray absorptiometry (DXA), which is available only in tertiary hospitals and has high evaluation costs with regard to the elderly. The osteoporosis self-assessment tool (OST) has been developed to screen osteoporosis in the general population; it aims to target high-risk groups to perform DXA examination. The fracture risk assessment tool (FRAX), Osteoporosis risk assessment instrument, and simple calculated osteoporosis risk estimation are some examples of OST and fracture risk prediction tools.[3] These individual screening tools use different parameters such as age, weight, height, sex, underlying diseases, past history of fractures, and some osteoporosis-related-factors.[4]
The OST for Asians (OSTA) index is a screening osteoporosis tool that uses age and weight data from the Asian postmenopausal population. The OSTA index has been found to have excellent sensitivity (91%) for screening femoral neck osteoporosis at the cut-off value of −1.[5] However, the performance of the OSTA index varies according to population and gender.[4] Validation is required to determine the optimal cut-off point in individual populations. Combining the OSTA index with some potential parameters such as quantitative calcaneal ultrasound [6,7] and calcaneus bone densitometry [8] has been proposed to increase its ability to carry out osteoporosis prediction. Moreover, many diagnostic models using artificial intelligence have been developed to identify the risk groups of osteoporosis.[9] Nevertheless, one limitation of these osteoporosis diagnostic models is the difficulty and inconvenience of obtaining potential parameter data from patients or healthcare workers.
Previous studies have reported that age and weight are the strongest potential predictors for osteoporosis diagnosis. A previous study employed an osteoporosis diagnostic formula that used weight and age parameters, which had a sensitivity of 78.5% and a specificity of 72.0% in females and a sensitivity of 87.2% and a specificity of 69.6% in males. Further, area under receiver operating characteristic (AUROC) curves were 0.825 in the female and 0.858 in the male population.[10] However, this formula was only validated using femoral neck bone mineral density (BMD). Moreover, ethnicity and race are important osteoporotic risk factors. Specific diagnostic models should be developed and validated in individual countries.[11]
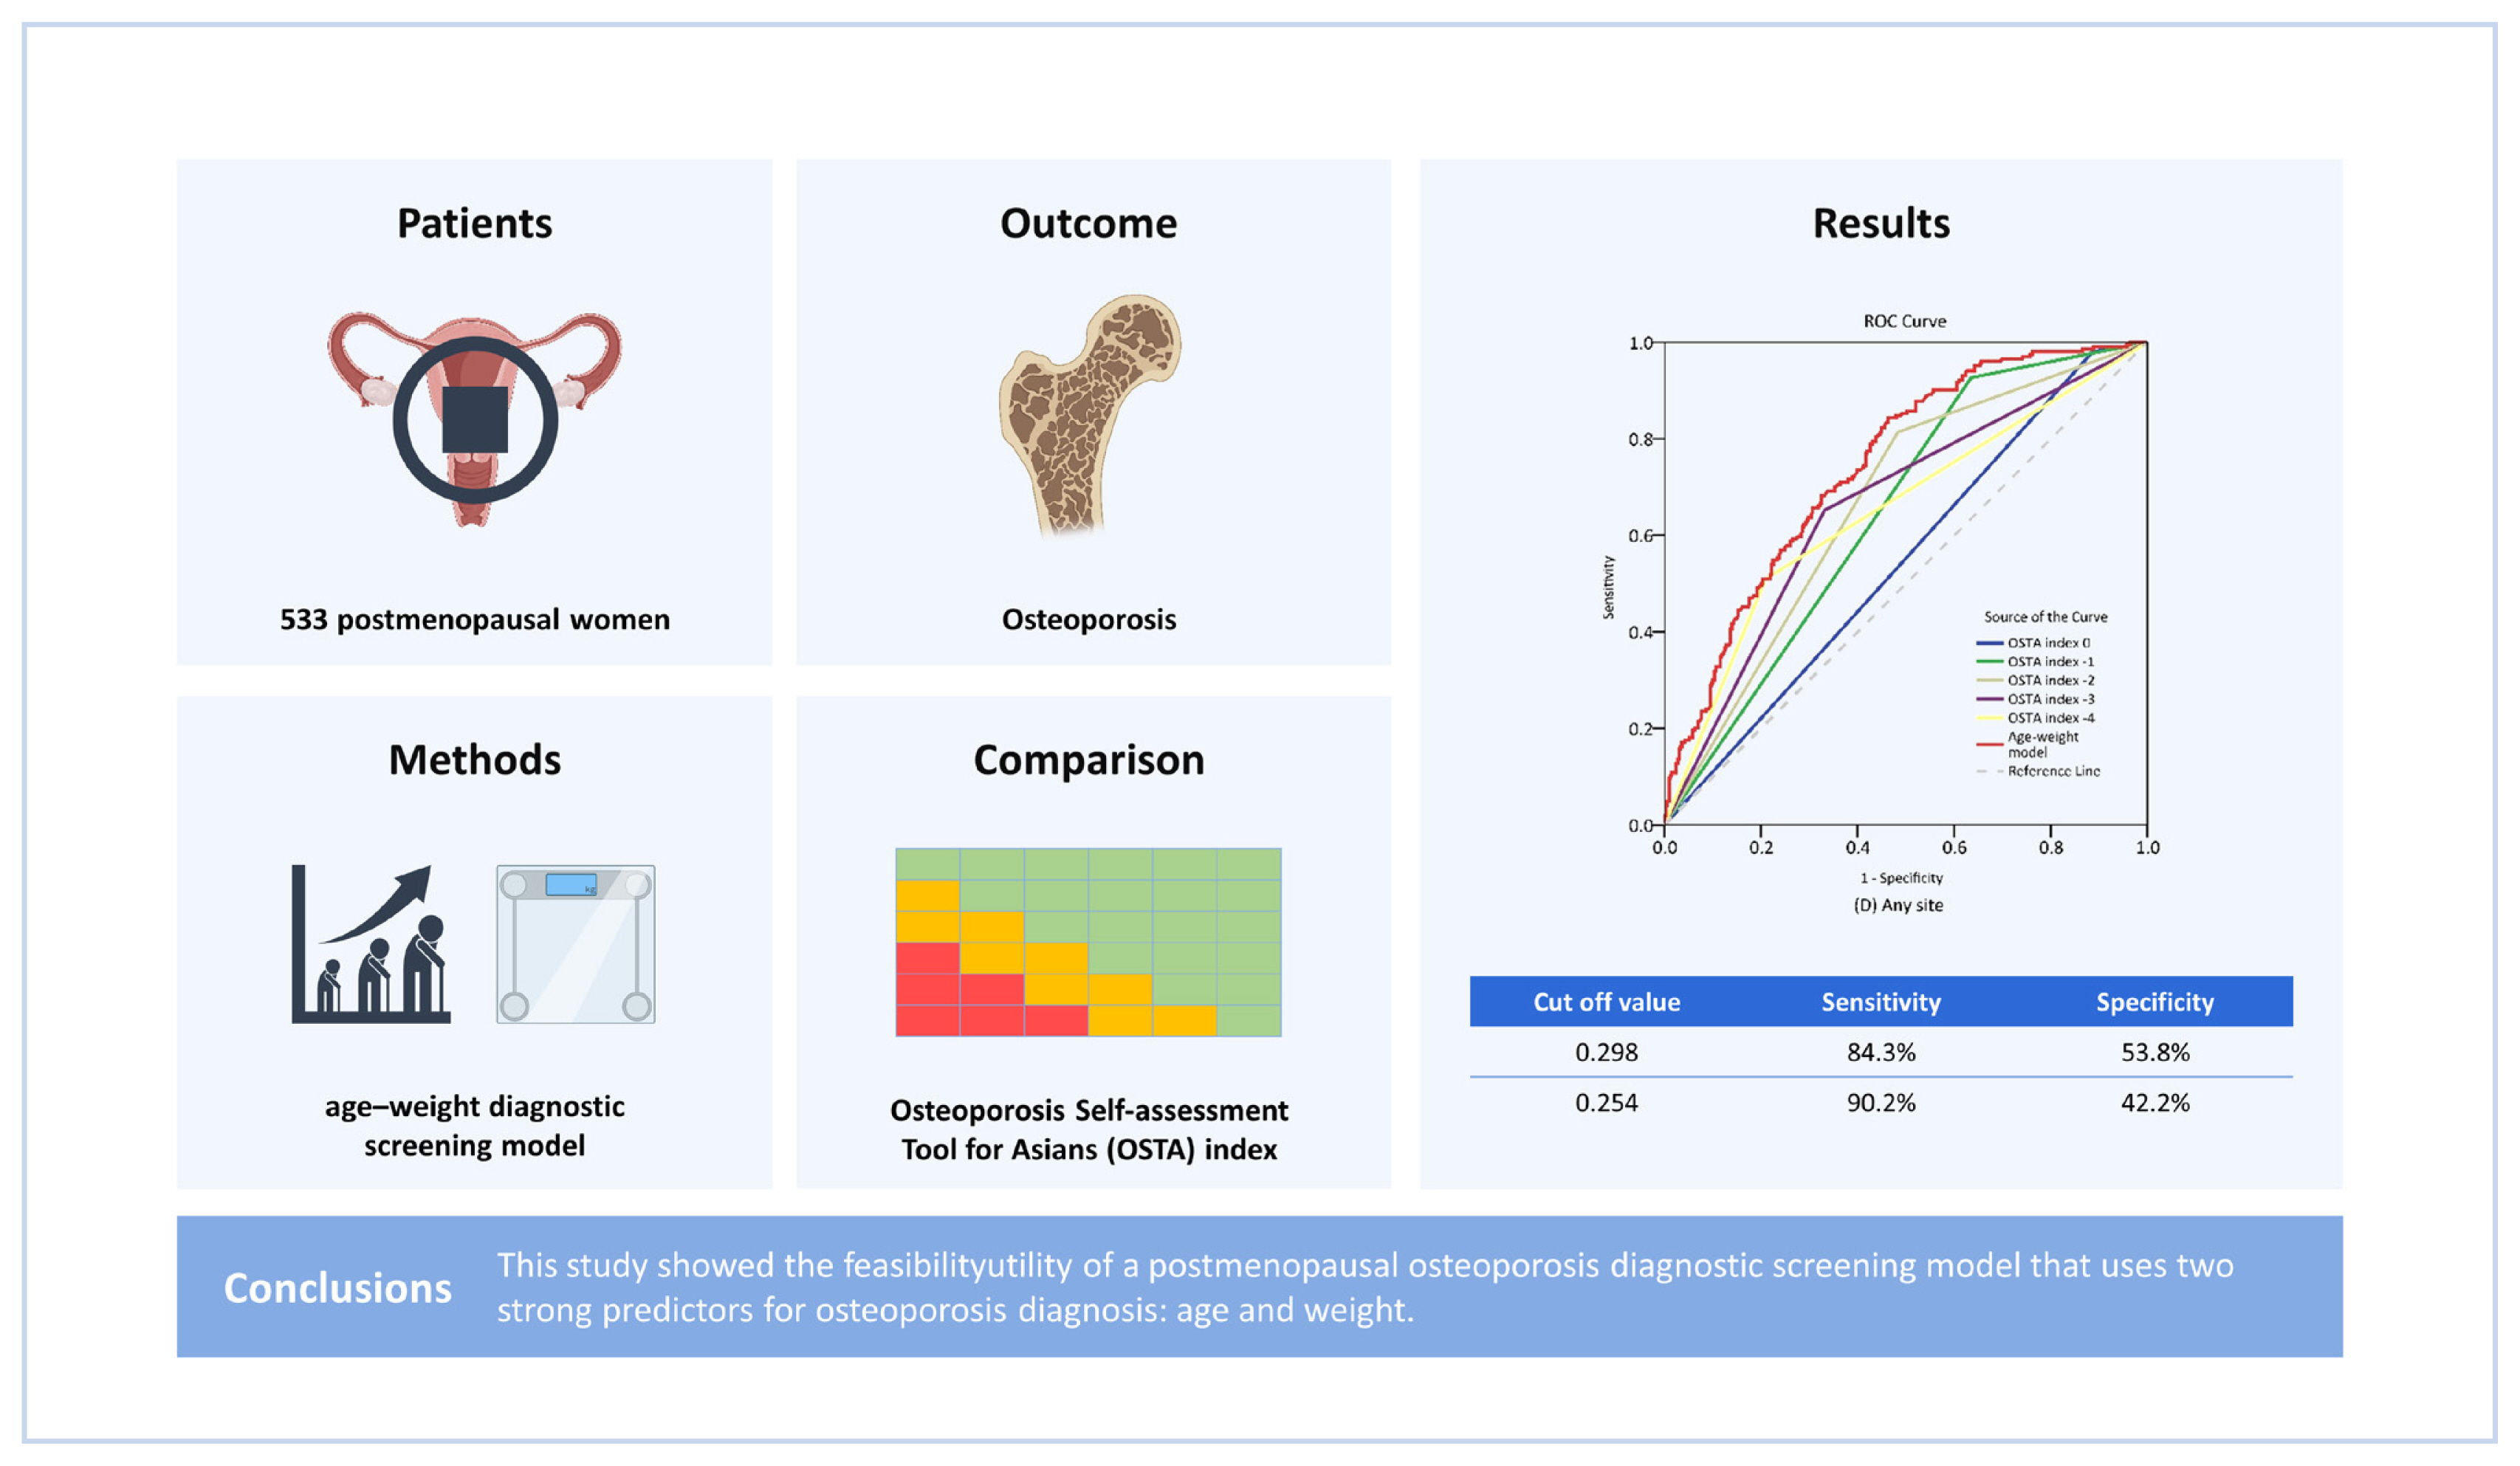
This study aimed to developed and validated a model to diagnostic screening osteoporosis in postmenopausal women. The performance of the model in screening osteoporosis was validated and evaluated through comparison with the OSTA index.
METHODS
1. Study population
This retrospective study collected demographic data and laboratory factors such as age, weight, height, serum creatinine, and hemoglobin from electronic medical records of postmenopausal women aged ≥50 years old who had undergone DXA from November 2017 to April 2022, and BMD was used in analysis. Participants who had received osteoporosis treatment or had a history of lumbar spine surgery or hip surgery were excluded from the study. Participants with incomplete data were also excluded from the study. The study protocol was approved by the Institutional Review Board Committee.
2. Data collection and measurement
Height and weight were measured by an electronic stadiometer (NAGATA BW-1116MH; Nagata Scale Co. LTD, Tainan, Taiwan) on the day of BMD measurement. All participants wore lightweight clothing without shoes during weight measurement. A 0.1 kg weighing scale was used. For height, the nearest 1 cm height scale was used. Body mass index (BMI) was calculated by dividing body weight (kg) by the square of body height (m2). The OSTA index was calculated by the formula of 0.2×(body weight - age), in which the decimals were truncated to an integer. Hemoglobin and serum creatinine data recorded during the 6 months before or after the BMD measurement date were collected. If there was more than one value, the value before BMD measurement date was collected for analysis. Estimated glomerular filtration rate (eGFR) was calculated by the chronic kidney disease-epidemiology collaboration equation.
3. BMD measurement
All participants underwent DXA at 2 sites, the lumbar spine (L1-4) and the hip (femoral neck and total hip) with the same DXA machine (Discovery W; Hologic Inc., Bedford, MA, USA) which was operated by a professionally trained technician. The T-score interpretation used an Asian-matched value. BMD results were classified by the World Health Organization criteria. T-scores of −2.5 standard deviations (SDs) below the reference mean or less were defined as osteoporosis, T-scores between −1.0 and −2.5 SD were defined as osteopenia, and T-scores −1.0 SD or greater were defined as normal.
4. Statistical analysis
Descriptive analysis such as mean values with SD when there was a normal data distribution, or median values with the twenty-fifth to seventy-fifth percentile ranges when there was a non-normal data distribution, was performed. The clinical characteristics of the participants were divided into 3 groups according to the highest BMD T-score at any BMD site. Individual BMD sites were examined for osteoporosis characteristics. A participant whose T-score was ≤−2.5 was allocated to the osteoporosis group. A participant whose T-score was >−2.5 was allocated to the non-osteoporosis group.
Logistic regression analysis for binary outcomes was used to perform data analysis. The selection of predicting factors was based on a combination of clinical experience, literature review and statistical significance. The few simple predictors used were selected for the convenience of the user. The proposed model was developed according to the sites of BMD measurement. The age-weight regression model was developed through 4 models according to BMD site (lumbar spine, femoral neck, total hip, any site). The sensitivity, specificity, positive predictive values, negative predictive values were analyzed. The Youden index was used to determine the optimal cut-off value of each individual diagnostic model. Discrimination ability of the models was assessed through AUROC. The AUROC of each model was compared with the highest AUROC of the OSTA index cut-off value model.
The diagnostic screening model of BMD data at any site was used as a representative model to test the calibration using a modified calibration plot. The predicted probability of a patient being diagnosed was divided into deciles. The predicted probability curve was divided into deciles and plotted at the decile mid-points of the model-predicted values on the x-axis, and the observed proportions diagnosed with osteoporosis within each decile were plotted on the y-axis. Hosmer-Lemeshow goodness-of-fit was the test used for calibration.
According to the calculations of a binary outcome prediction model, which found a postmenopausal osteoporosis prevalence of 32.7%, [12] the margin of error was 4%, a 95% confidence interval was used, and the sample size was 529 participants.[13] All data were analyzed using IBM SPSS Statistics for Windows, version 26.0 (IBM Corp., Armonk, NY, USA). A P value of less than 0.05 was considered statistically significant.
RESULTS
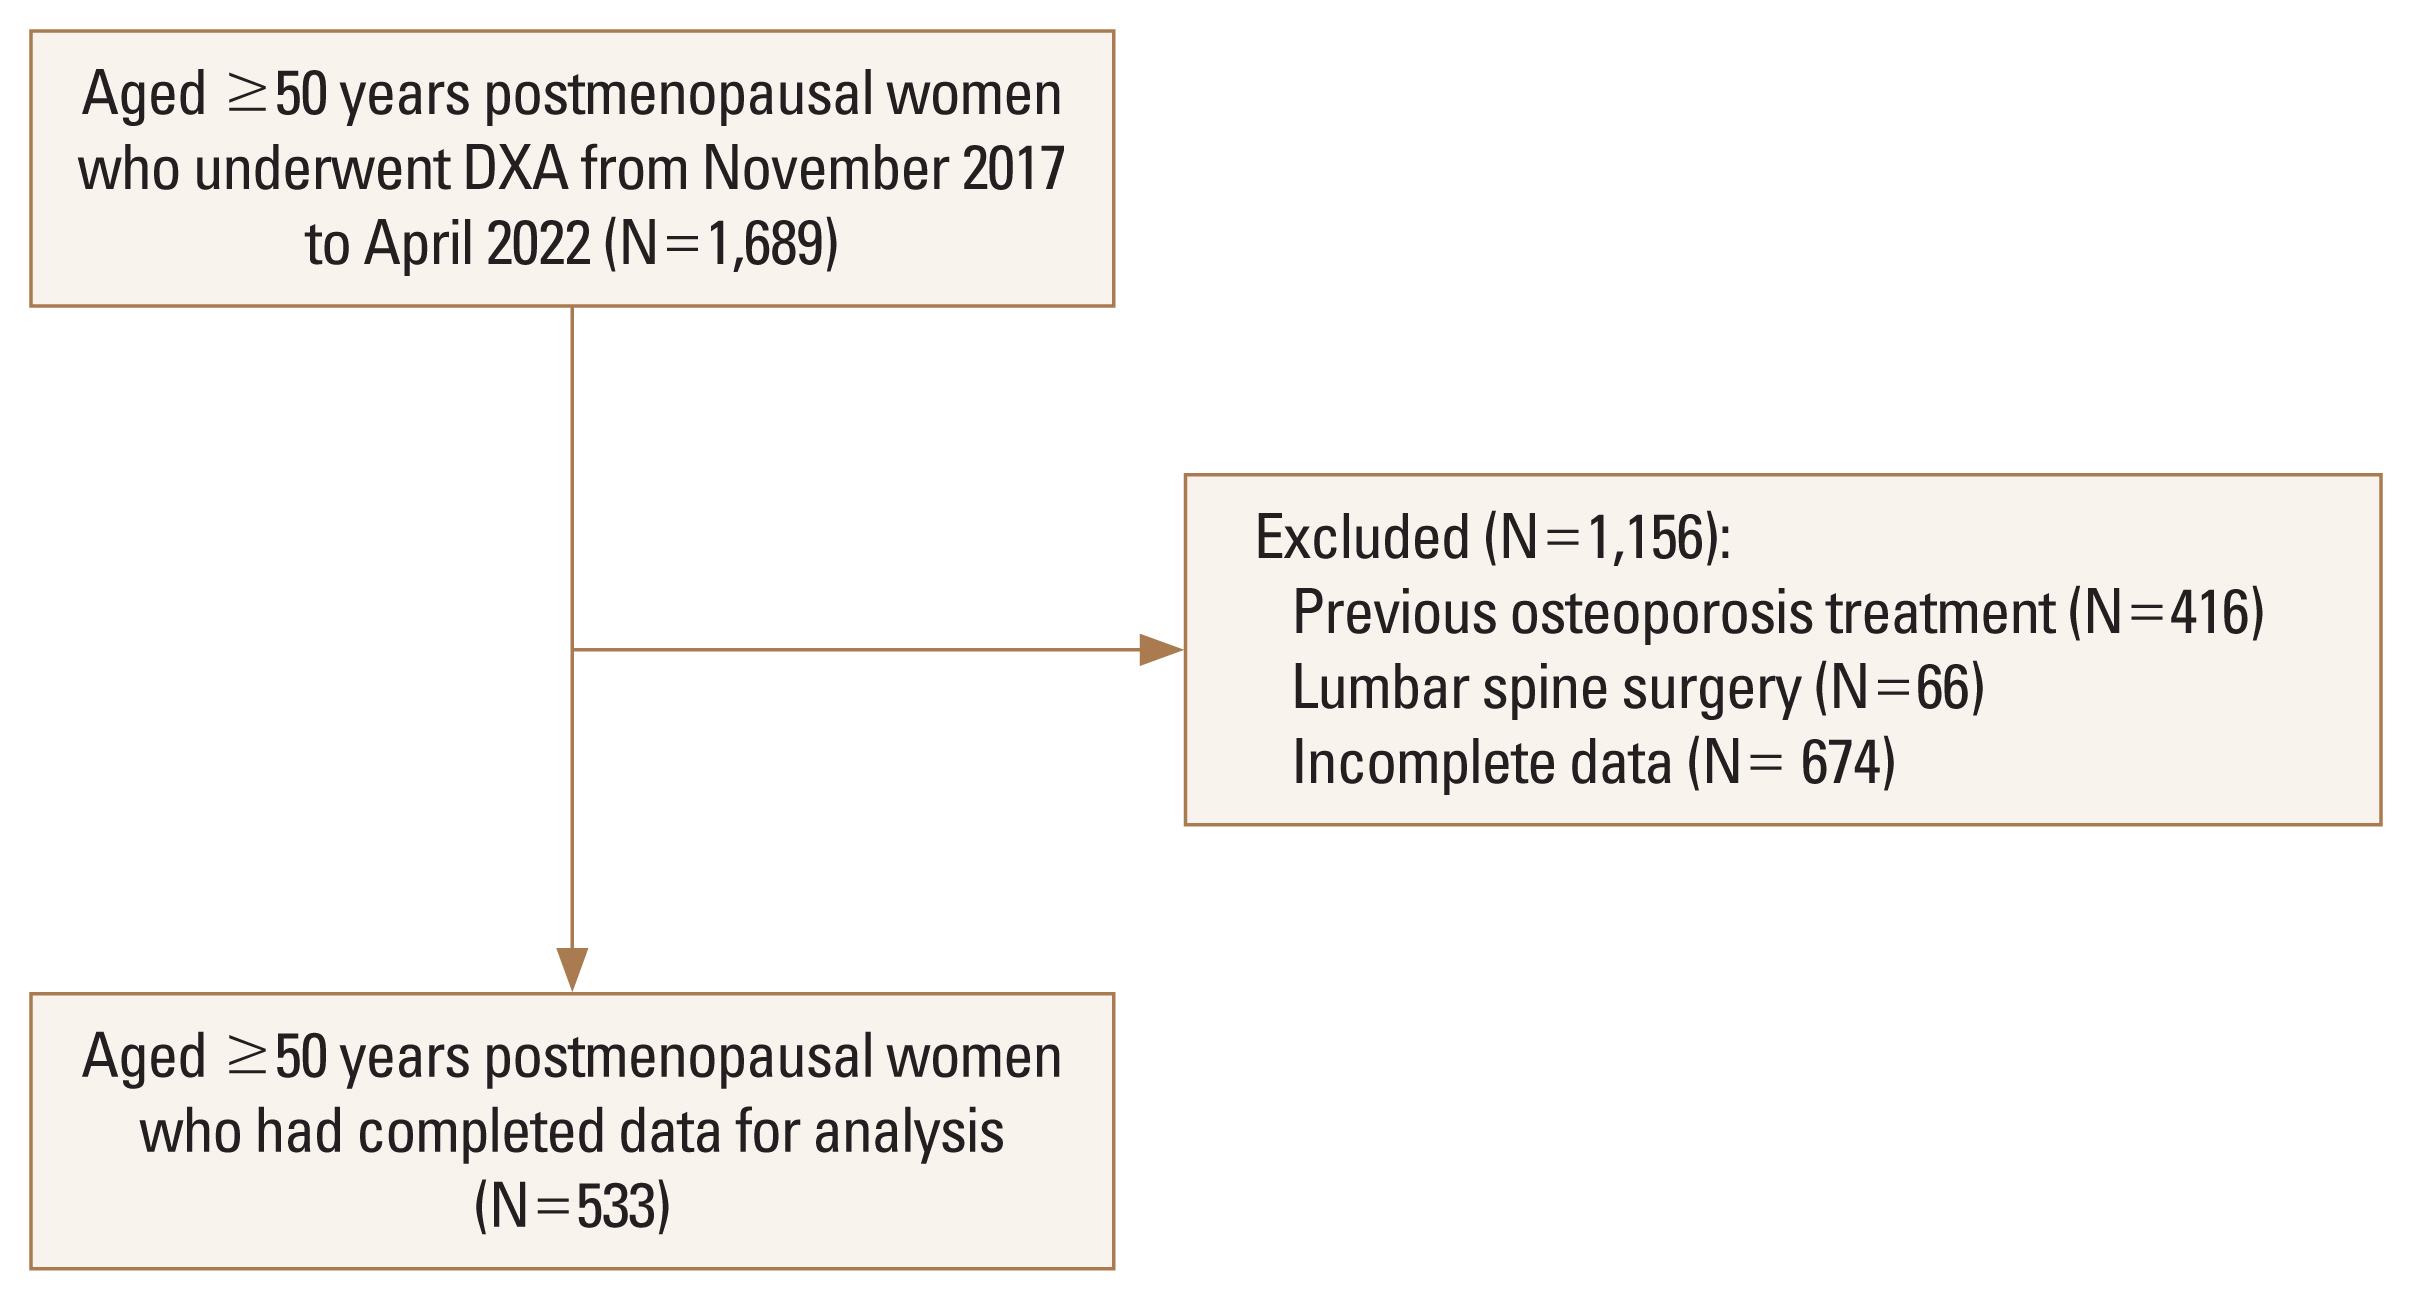
A total of 1,689 participants aged 50 years or older were included in the present study. A total of 416 participants were excluded because they had received osteoporosis treatment, 66 participants were excluded because they had had lumbar spine surgery, and 674 participants were excluded because of incomplete data. The remaining 533 postmenopausal women, who had a mean age of 72.7 (SD, 8.3) years, were included in the analysis (Fig. 1).
According to the BMD at any site, the prevalence of osteoporosis and osteopenia was 38.3% and 48.8%, respectively. Demographic data and laboratory findings classified by BMD status regarding the osteoporosis, osteopenia and normal BMD groups are shown in Table 1. Age, weight, height, BMI, and OSTA index values were significantly different among the groups (P<0.05). However, there were no significant differences in serum creatinine, eGFR, and hemoglobin values among the 3 BMD status groups (Table 1). The characteristics of the osteoporosis group when compared with the non-osteoporosis group are shown in Table 2. Age, weight, height, BMI, and OSTA index values were mostly different between the groups.
Age and weight, as the strongest potential predictors of osteoporosis, were selected to be used in the logistic regression. The pseudo-R-squared value of the femoral neck osteoporosis model was slightly higher than those of the other models (Table 3). The probability formulae used to diagnose osteoporosis were the following:
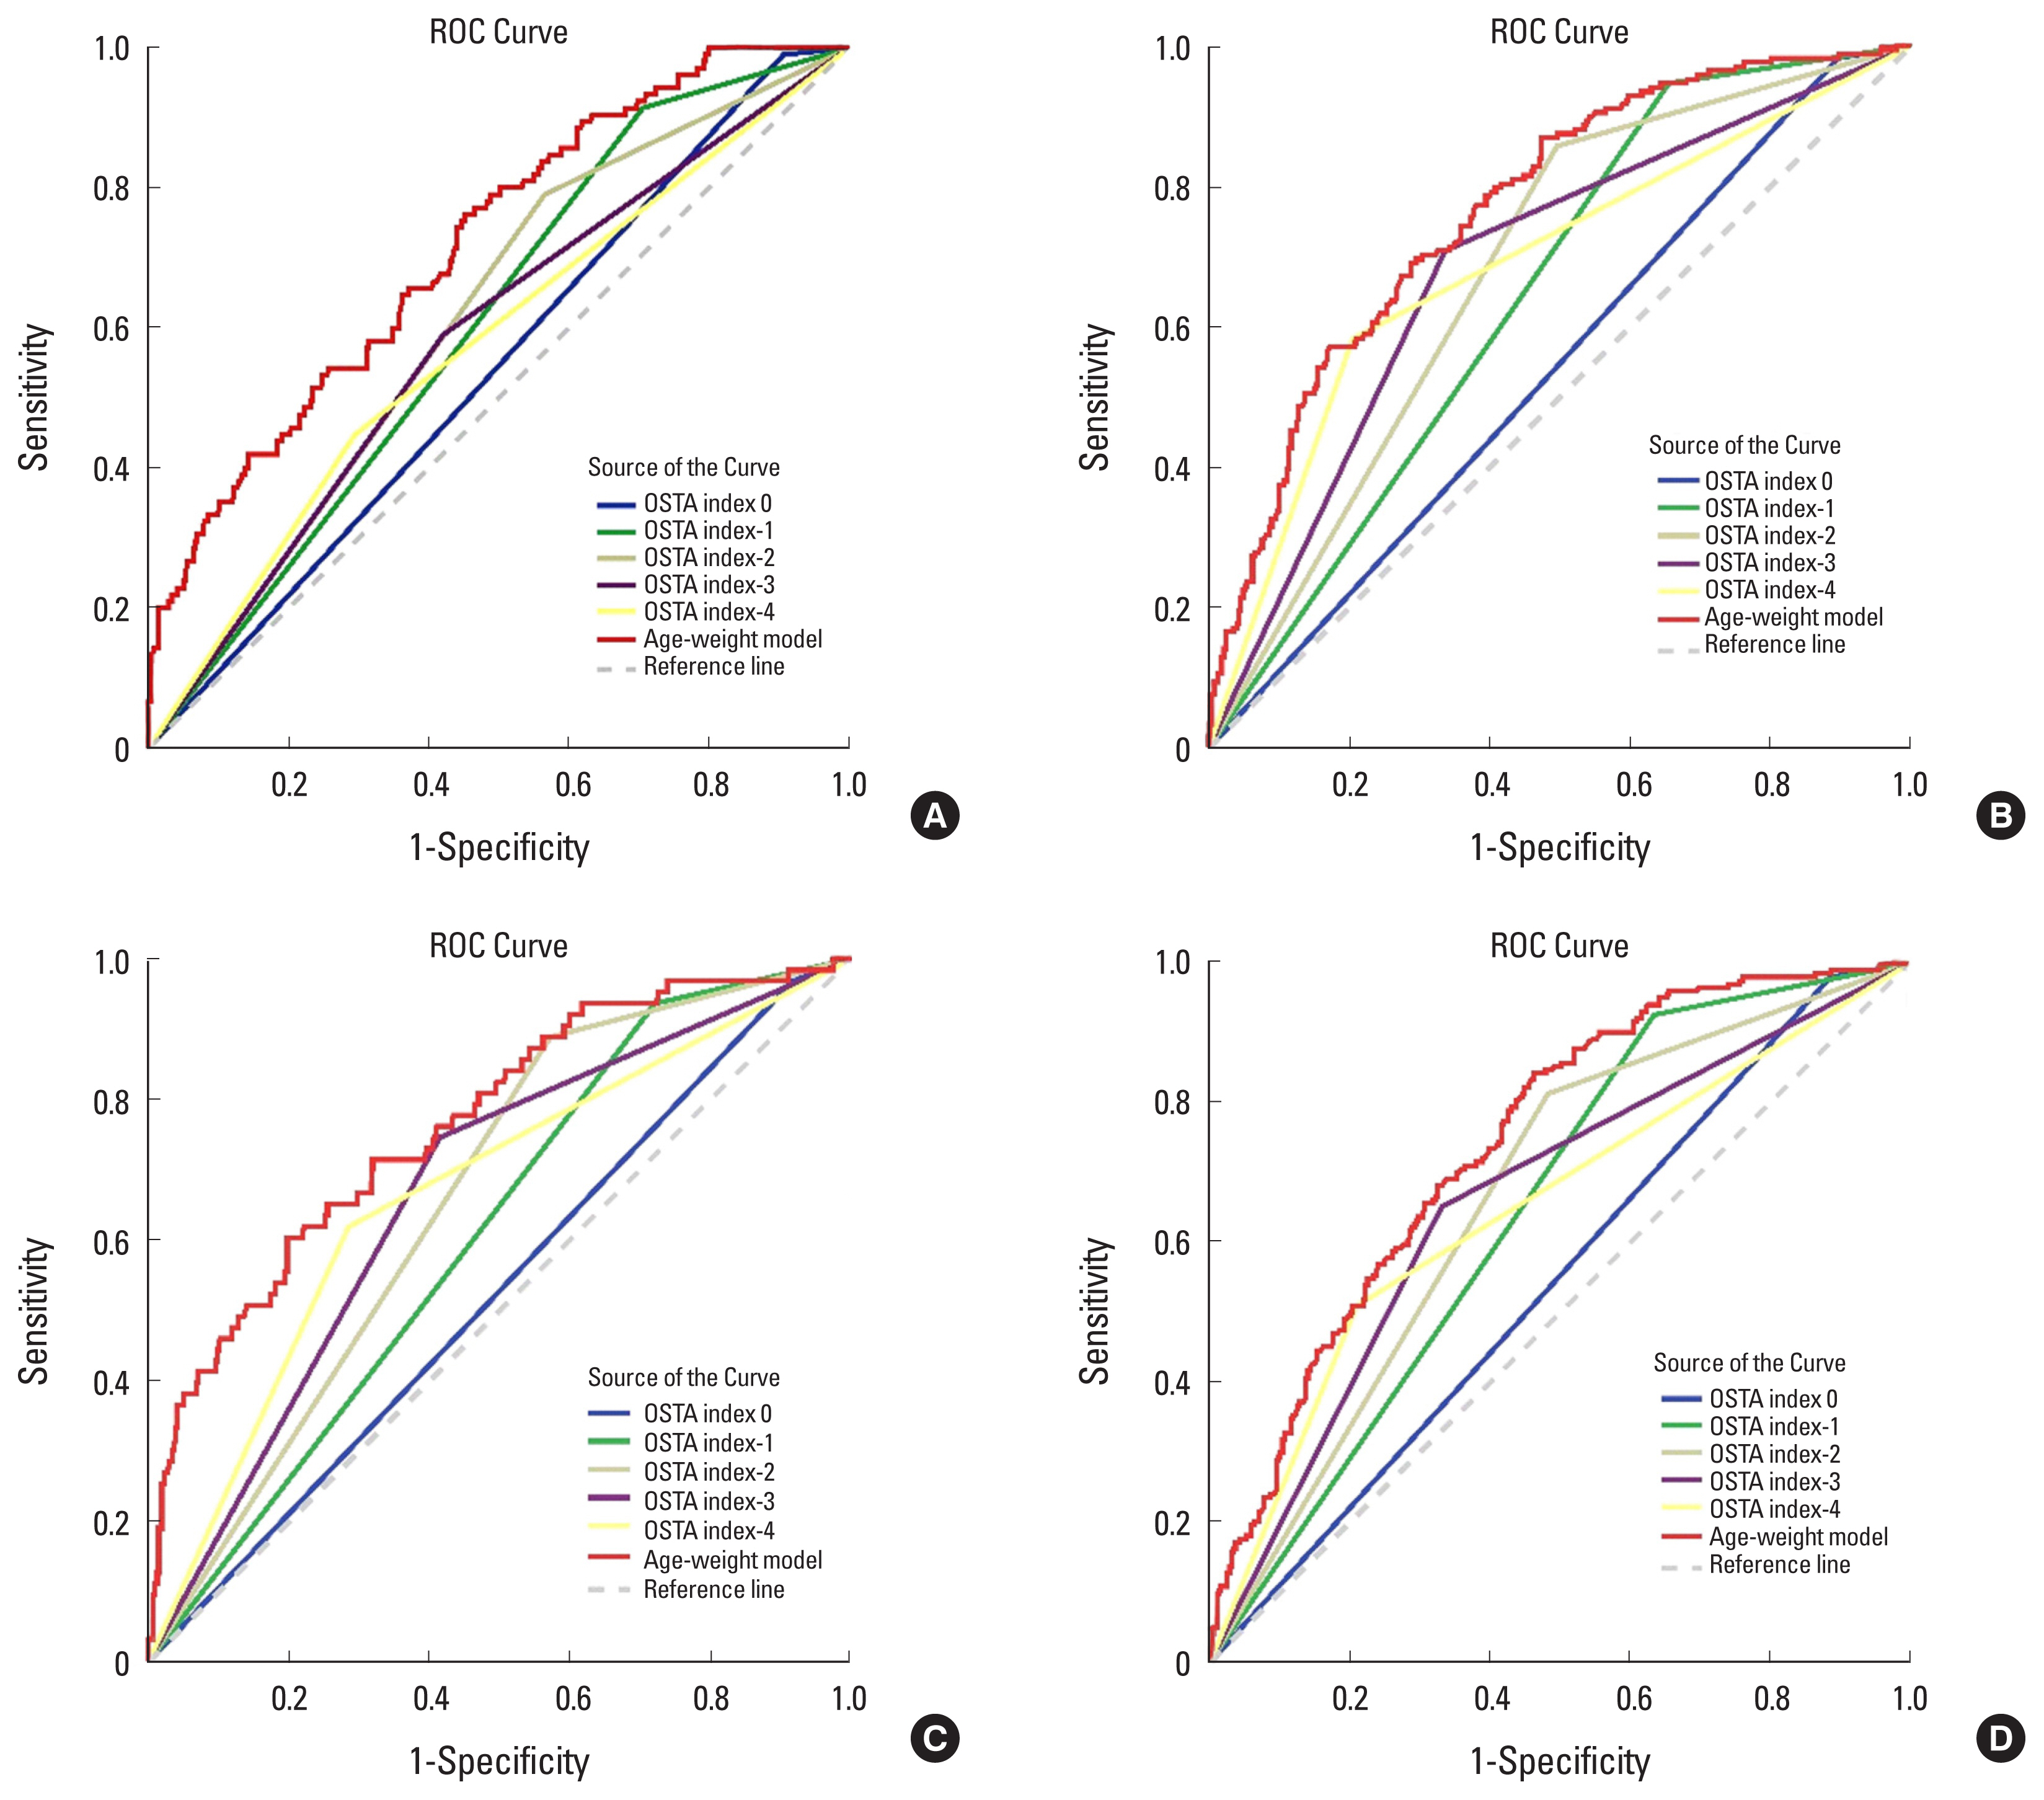
The highest AUROC, which was derived from the femoral neck osteoporosis model, was 0.768. The AUROC from all the models were significantly higher than that from the OSTA index model (P<0.05). Regarding all of the any-site osteoporosis models, the OSTA index −2 model provided the highest Youden index (0.331) value, having a sensitivity of 81.4% and a specificity of 51.7%. Meanwhile, the any-site osteoporosis model developed in this study yielded a higher Youden index (0.338) value, having a sensitivity of 84.3% and a specificity of 53.8% at the probability cut-off value of 0.298 (Table 4 and Fig. 2).
The Hosmer-Lemeshow goodness-of-fit statistics for the lumbar spine, femoral neck, total hip, and any-site models were insignificant (P=0.177, 0.379, 0.228, and 0.076, respectively). Increasing model-predicted probability values for osteoporosis in each decile was observed for the any-site prediction model. In the fourth decile, the model had a sensitivity of 90.2% and a specificity of 42.2%, providing a positive likelihood ratio (LHR+) value of 1.56. Meanwhile, in the ninth decile, it had a sensitivity of 33.8% and a specificity of 88.5%, leading to a LHR+ of 2.93 (Table 5). The modified calibration plot showed agreement between the model-predicted probability and the observed proportion of participants with osteoporosis for each decile of probability (Fig. 3).
DISCUSSION
Many osteoporosis diagnostic tools and FRAX have been developed in previous studies. Different predictive factors have been selected in individual models to increase their discriminative ability. The OSTA index is one of the OST models that has been developed to use only 2 potential predictive factors to diagnose osteoporosis. Hence, the OSTA index has been widely validated, and it has been found that its cut-off value should be changed according to sex and ethnicity. The present study demonstrated that the adjusted coefficients of the parameters in the OSTA index increased the model’s performance and discriminative ability in postmenopausal osteoporosis screening compared to the traditional OSTA index model.
In this study, the prevalence of postmenopausal osteoporosis was 31.5% at the femoral neck and 19.7% at the lumbar spine, percentages higher than those reported in a previous study in our country.[14,15] This may have been because the participants in this study were older than those in the previous study. In this study, the mean ages of the femoral neck and lumbar spine groups were 76.1 and 72.9 years, respectively, while in the previous study, the mean ages for these groups were 60.5 and 54.8 years old, respectively. According to the Thai BMD reference, the prevalence of osteoporosis has a positive correlation with age at both the femoral neck and lumbar spine.[16] Most participants in this study were obtained from an orthopedics outpatient department; these participants may therefore have been more concerned about osteoporosis or have had more osteoporosis risk factors than those in the previous study.
Advanced age, an important risk factor for osteoporosis, was used as a predictive factor in the diagnostic screening model developed in this study. The results found that age was positively correlated with osteoporosis at any site. However, age was not associated with osteoporosis in the lumbar spine, which may have resulted from degenerative changes, calcification or fracture in the lumbar spine. Degenerative changes may cause falsely elevated BMD and misinterpretation of the prevalence of osteoporosis in the spine.[17]
Regarding weight, a previous study reported that low body weight, such as less than 58 kg, was a risk factor for osteoporosis.[18] However, the cut-off point used for low body weight still varies among different countries. A model that uses crude weight would have higher accuracy than models that use a binary weight parameter.
Age and weight parameters are robust independent potential factors for osteoporosis. Moreover, in this study, these 2 factors were easily obtained from a routine outpatient examination. An age-weight osteoporosis diagnostic screening model has been previously developed, but validation of this model should be performed before the model is implemented in other populations.[10] The age distribution in a given population may be an important factor in determining the diagnostic performance of an age-weight model. The mean age of our participants was higher than that of those in a previous study (72.7 vs. 60.0 years). This study aimed to develop a new age-weight model that may be more suitable to our population. Our age-weight diagnostic screening model for osteoporosis in postmenopausal women at any site had a similar discriminative performance to that of a previous study (AUROC, 0.744 vs. 0.825). Future studies of the performance of the age-weight model adjusted for the age group will be required to elucidate the effect of age in the screening model.
The age-weight diagnostic screening model developed in the present study showed higher discriminative ability and higher Youden index values than the OSTA index model at the different cut-off value. Therefore, our age-weight model may be more appropriate than the OSTA index model in osteoporosis prediction in our population. A calibration plot was used to determine the clinical implications of our age-weight model. For screening purposes, sensitivity may be the most critical concern. Generally, a sensitivity of 90% is utilized for the OST index model.[19] Therefore, in our age-weight model, an optimal predicted probability cut-off value of 0.254 was found to offer a sensitivity of 90.2% and a specificity of 42.2%. However, clinical utility should be further evaluated after implement this model in the routine practice.
This study had several limitations. Firstly, the study populations were recruited in one tertiary hospital, and they therefore may not reflect the true population. Generalization of the age-weight diagnostic screening model in different countries or races with larger sample sizes from multi-centers should be performed. Moreover, validation the model in overweight women should be analyzed to clarify the clinical utility. Secondly, body weight is a dynamic parameter. A previous study reported an association between weight change and osteoporosis. Alterations in weight may increase the probability of osteoporosis.[20] Further studies using dynamic weight changes as a parameter in the diagnostic model may be necessary to explain the real effect of alterations in weight.
In conclusion, this study demonstrated the utility of a diagnostic screening model that uses 2 robust predictive factors, age and weight, in the diagnosis screening of postmenopausal osteoporosis. This age-weight osteoporosis diagnostic screening model was proven to be a simple and effective option for postmenopausal osteoporosis screening.

 PDF Links
 PubReader
 ePub Link
 Full text via DOI
 Download Citation
 Print
Print