


INTRODUCTION
As the elderly population increases, many social and economic burdens caused by osteoporosis and osteoporotic fractures have already been reported in developed countries.[1] Providing these patients with various services for evaluation and management of osteoporosis and fracture prevention not only increases patients’ satisfaction with medical care but also has the effect of reducing the socioeconomic burden required to manage them.[2] However, although dual energy X-ray absorptiometry (DXA) is one of the preferred modalities for screening or diagnosis of osteoporosis and can predict the risk of osteoporotic fracture to some extent, it is difficult to screen osteoporosis unless the patient visits a hospital.[3,4] In addition, the purpose of visiting the hospital may affect whether or not DXA is implemented.[4] In busy outpatient clinics, it is easy for medical staff to miss out on the evaluation and management of osteoporosis.[5] Therefore, preventing or diagnosing osteoporosis early may be more effective than treating osteoporosis after disease progression or osteoporotic fractures occur.
Machine learning (ML) is a method of self-learning using data without special instructions to find complex patterns and create models.[6,7] A computational modeling tool using ML of artificial intelligence (AI) is widely used to predict the occurrence of disease or fracture and to estimate clinical outcomes in various clinical areas.[8,9] ML has made important improvements and discoveries in the medical field and is also being applied in rheumatism and osteoarthritis and has achieved many achievements.[10-12] The prediction model using ML can compensate for the shortcomings of conventional examination methods and handle large numbers of input variables simultaneously. Also, if an automated system of AI is constructed, there is an advantage that the hassle of checking examinations can be solved.[13] Thus, using ML and big data, it is possible to make a big change in the clinical pathway, which was previously used to screen and manage osteoporosis in postmenopausal women or old ages, to discover osteoporosis risk factors at an early stage and to implement interventions.
The purpose of this study was to verify the accuracy and validity of the use of ML to select risk factors, to discriminate differences in feature selection by ML between men and women, and to develop predictive models for patients with osteoporosis in a big database. The hypothesis of this study is that osteoporosis risk factors might be different between men and women in risk prediction models using ML.
METHODS
1. Ethics statement
Data from the 2008 to 2011 Korea National Health and Nutrition Examination Surveys (KNHANESs) were reviewed and approved by the Institutional Review Board of the Korea Centers for Disease Control and Prevention (Approval no. 2008-04EXP-01-C, 2009-01CON-03-C, 2010-02CON-21-C, and 2011-02CON-06-C). Informed consent was obtained from each participant when the 2008, 2009, 2010, and 2011 KNHANESs were conducted.
2. Participants
This study was based on data obtained from the 2008 to 2011 KNHANES conducted by the Korea Ministry of Health and Welfare. KNHANES is a nationwide representative cross-sectional survey of the Korean population; it uses a clustered, multistage, stratified, and rolling sampling design. It consists of 3 sections: a health interview, a health examination, and a dietary survey. More than 500 variables are examined each year the survey is conducted. These variables are included in a health questionnaire and in laboratory findings; data on nutritional factors are also collected.[14] Survey data are collected via household interviews and direct standardized physical examinations performed in specially-equipped mobile examination centers.
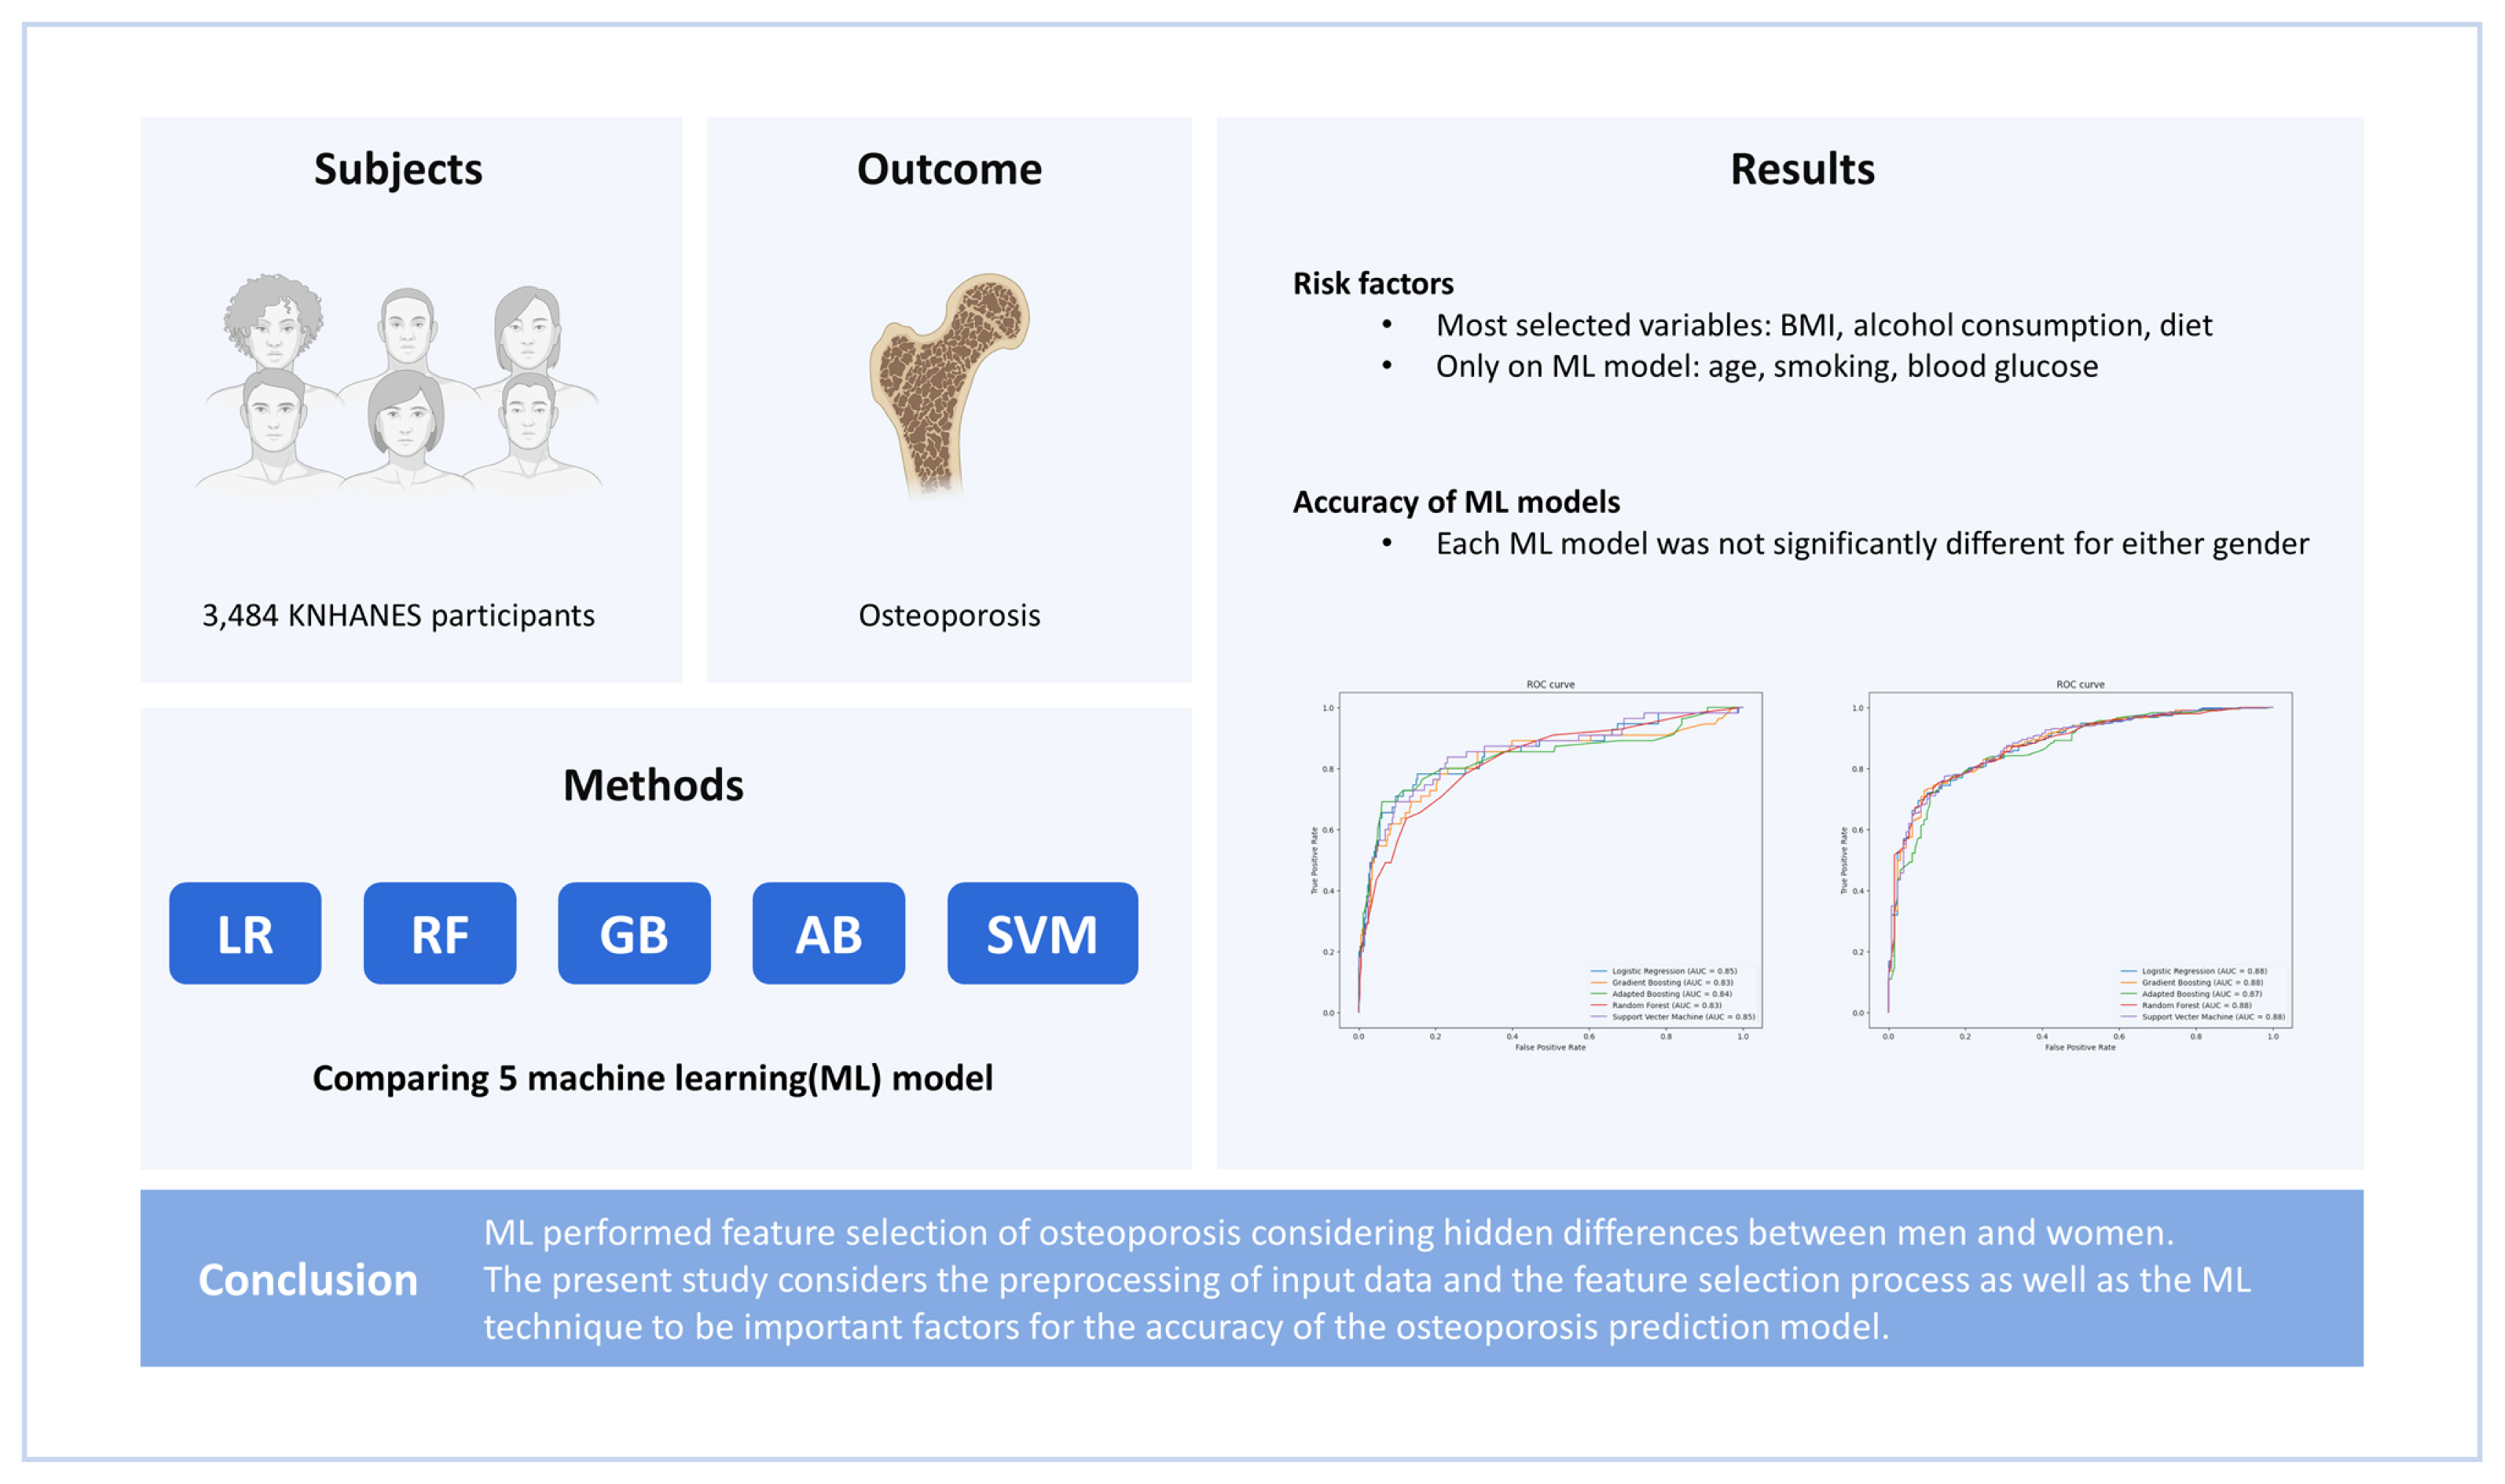
The data considered for use in this study were collected from a total of 37,753 the KNHANES participants (2008, 9,744 persons; 2009, 10,533 persons; 2010, 8,958 persons; and 2011, 8,518 persons). However, participants were excluded if they were non-menopausal if female, or less than 50 years old if male, or if the data required to evaluate skeletal muscle mass and dietary intake were unavailable. After these exclusions, data from a total of 3,484 participants (male 1,601, female 1,883) were included in the analysis (Fig. 1).
3. Measurement of bone mineral density (BMD) and diagnosis for osteoporosis
BMD (g/cm2) at the lumbar spine, femoral neck, and total proximal femur were measured by DXA (Hologic Inc., Bedford, MA, USA). According to the World Health Organization study group, the diagnosis of osteoporosis is based on T-score thresholds. T-scores at or above −1.0 are considered normal, those between −1.0 and −2.5 as osteopenia, and those at or below −2.5 as osteoporosis.
4. ML (random forest model) and knowledge-based feature selection
The data on 968 observed features of 1,601 male and 1,883 female participants from the KNHANES results were collected. During data curation, we manually excluded columns for unrelated features and features with missing values for more than 900 individuals. Then, the data from individuals without missing values were re-collected. A “osteoporosis” column was used as the classification label for the supervised learning. To find preliminary features that were well-related to osteoporosis, logistic regression (LR), random forest (RF), gradient boosting (GB), adaptive boosting (AB), and support vector machine (SVM) were used. A total of 53 candidate variables were used to train each of the 5 models, and features that were judged to be highly related to osteoporosis were selected. For hyperparameter tuning of 5 models, model optimization was performed using grid search. LR with least absolute shrinkage and selection operator (L1 norm) regularization was used to select features with coefficients other than 0, and for the remaining 4 models, permutation importance scores were calculated and features greater than 0 were selected. Among the features that appeared to be related to osteoporosis in each of the 5 models, features common to 3 or more models were selected. In the model using male data, 57 features were selected and, in the model, using female data, 54 features were selected, and selected risk variables that did not have clinically overlapping features.
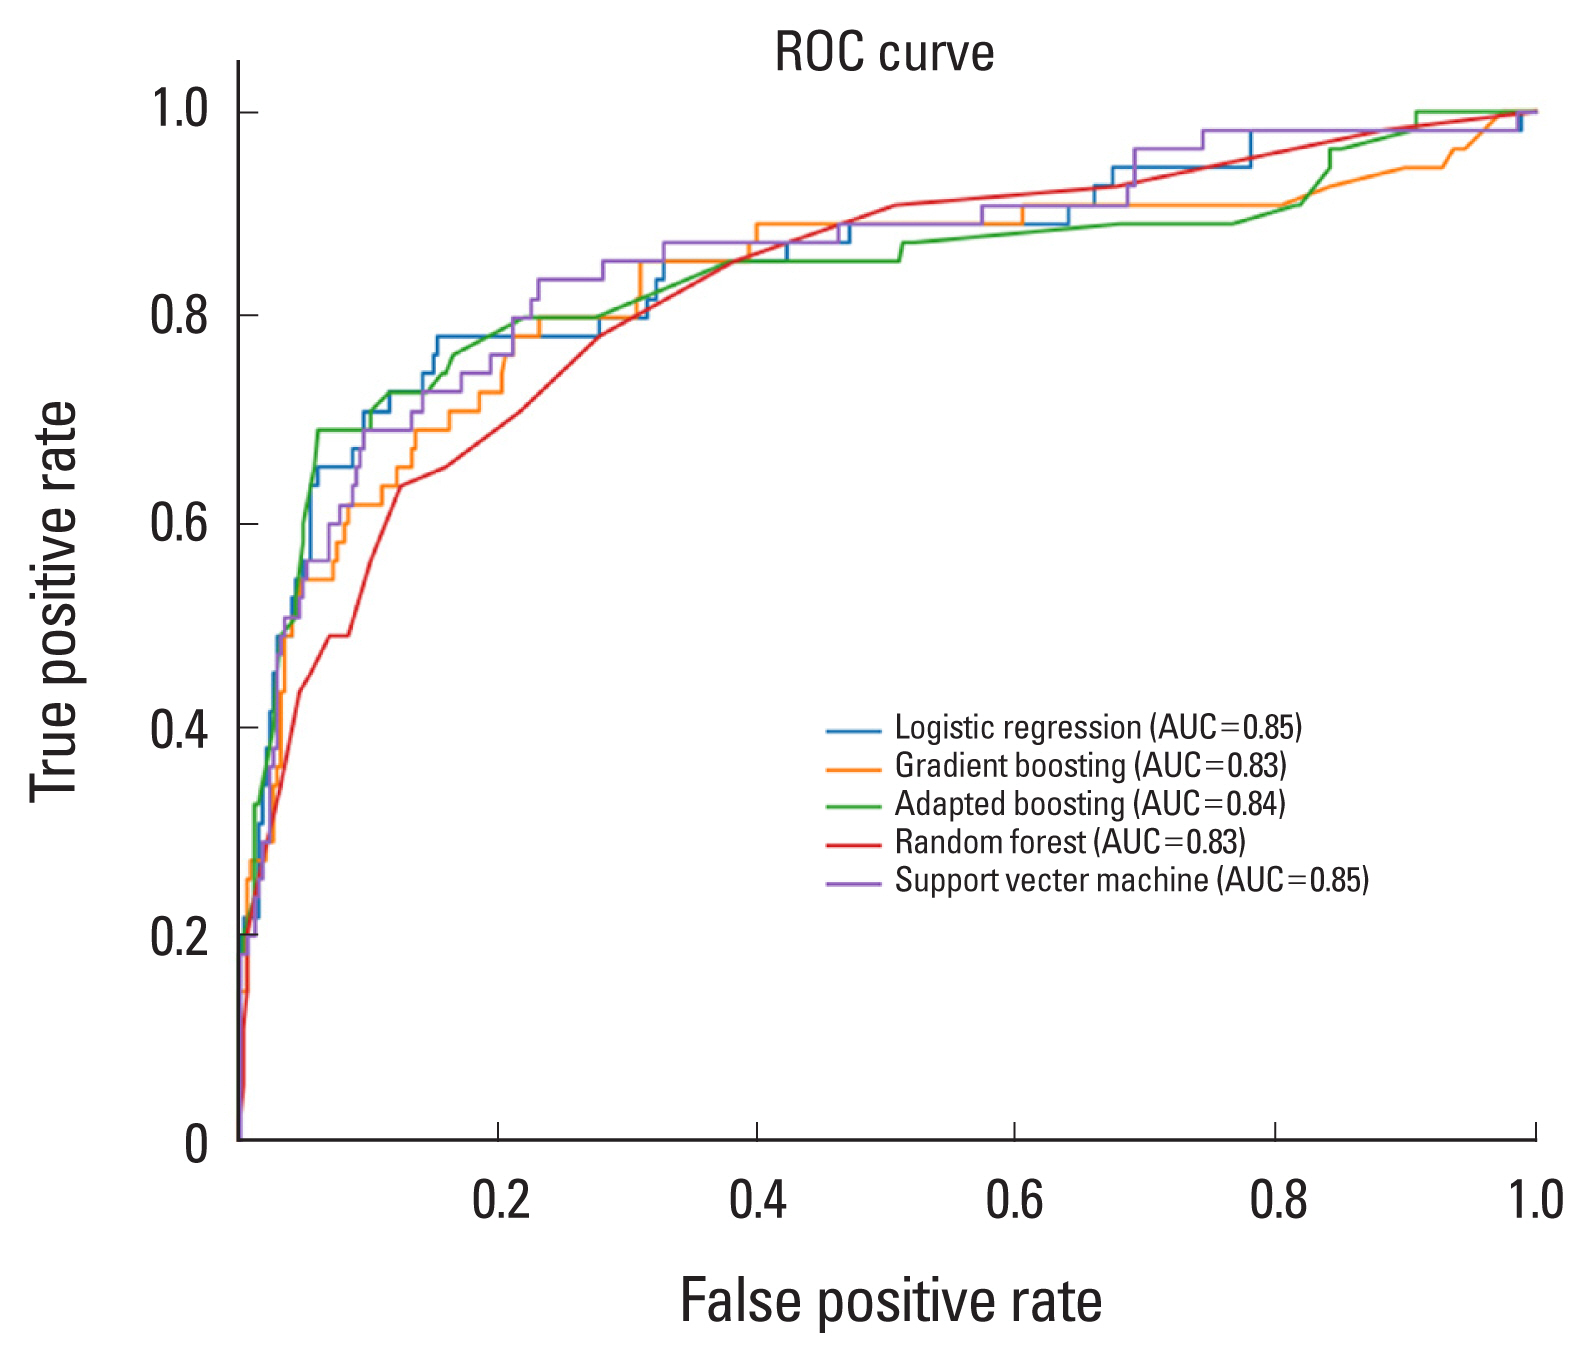
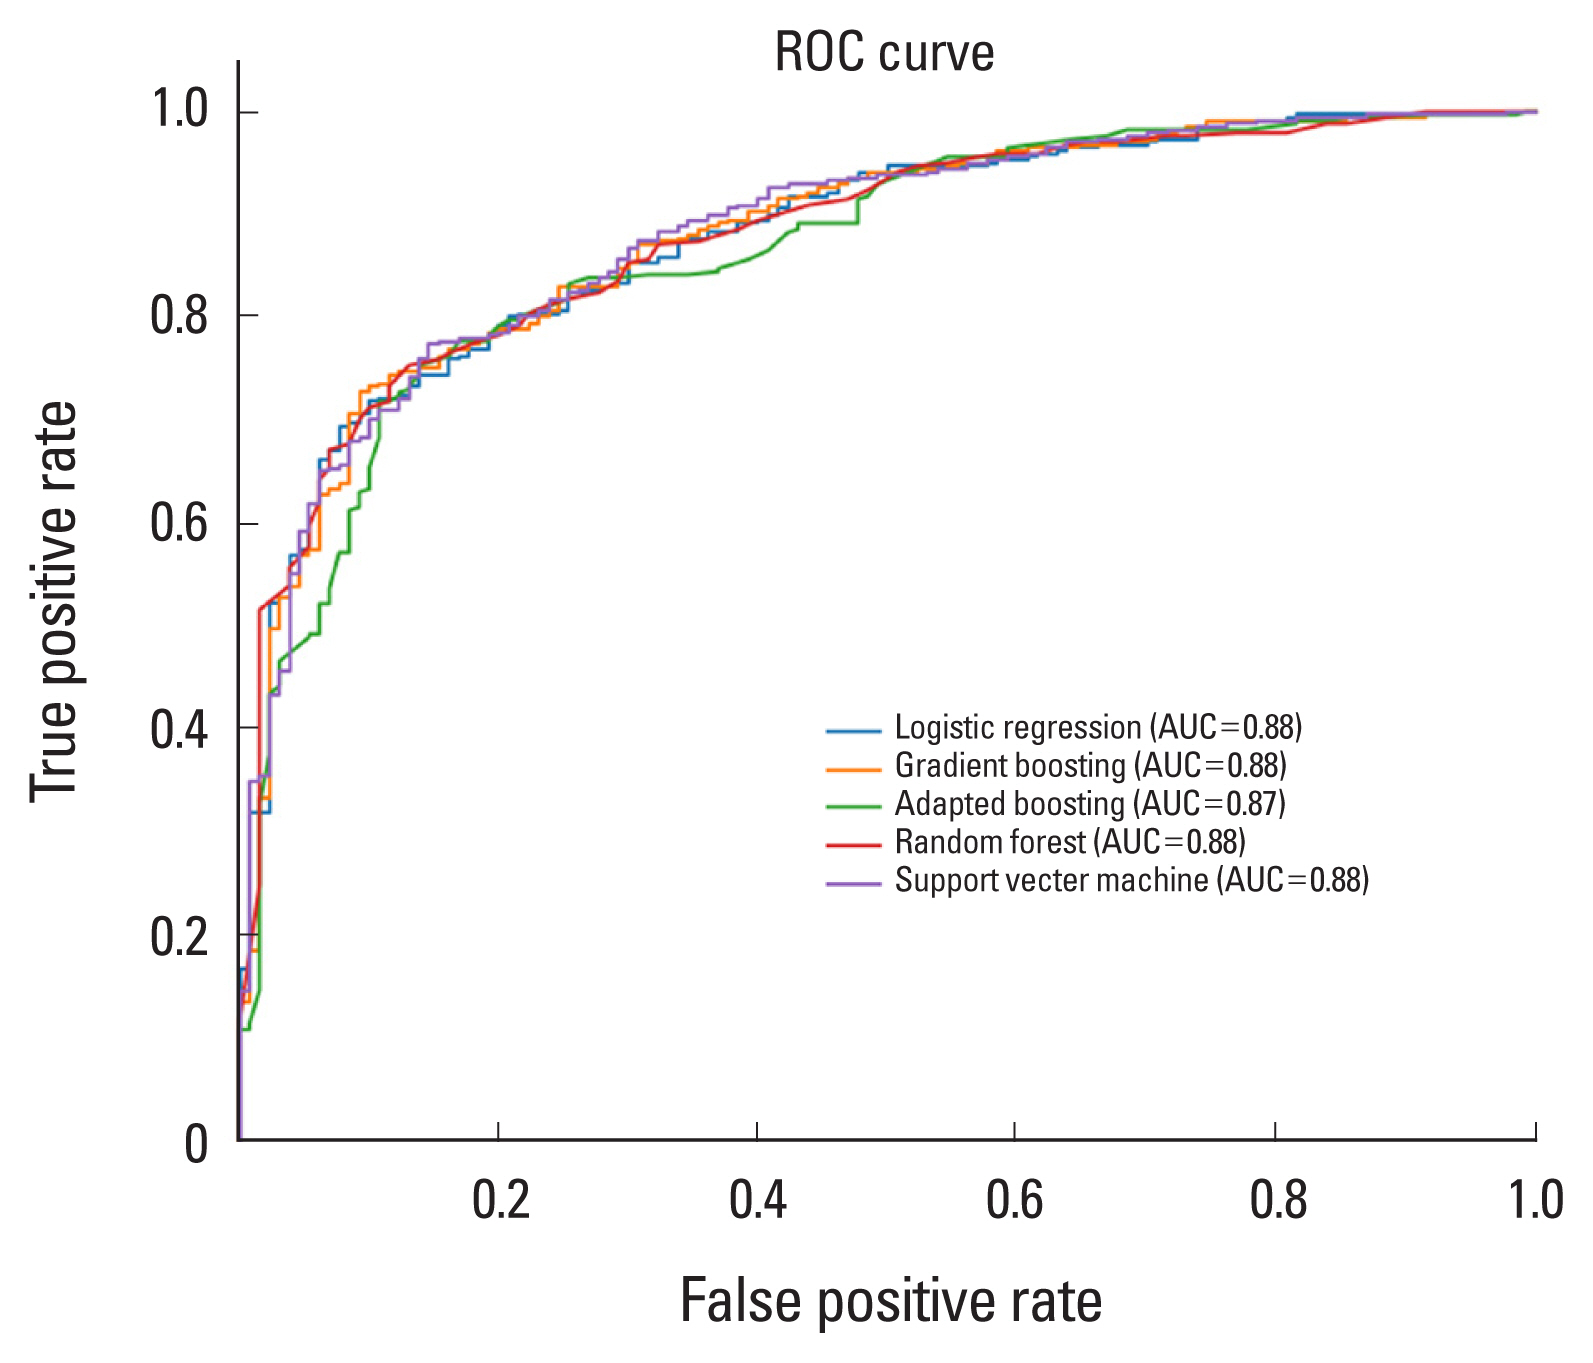
These selected risk factors were used to build predictive models for osteoporosis based on 5 classification algorithms (i.e., LR, RF, GB, AB, SVM). To determine the hyperparameter, we implemented 5-fold cross-validation of the training set with 30 times train/validation set shuffling and using the hyperparameters corresponding to each model. Each of the 5 classification models was built on the training set with the selected hyperparameters. Each model’s predicted probability of osteoporosis classification on the test set was subjected to receiver operating characteristic (ROC) curve analysis to obtain the reliability of the final model (Fig. 2, 3).
RESULTS
Among the 3,484 who were included in the study population, 1,601 (46.0%) were male and 1,883 (54.0%) were female. The features selected for men using the 5 methods are presented in Table 1. The significant feature in all 5 models was body mass index (BMI), and 23 features were selected from 4 models.
The features selected for women using the 5 methods are presented in Table 2. Significant features in all 5 models were monthly alcohol consumption, BMI, white blood cell, thrombocyte, food intake (g/day), water intake (g/day), calcium intake (mg/day), and niacin intake (mg/day). In osteoporosis feature selection by 5 ML models in this study, the most selected variables as risk factors in men and women were BMI, monthly alcohol consumption, and dietary surveys. However, differences between men and women in osteoporosis feature selection by ML models were age, smoking, and blood glucose level.
The ROC analysis revealed that the area under the ROC curve (AUC) for each ML model was not significantly different for either gender (LR: 0.85 in male, 0.88 in female; RF: 0.83 in men, 0.88 in women; GB: 0.83 in men, 0.88 in women; AB: 0.84 in men, 0.87 in women; SVM: 0.85 in men, 0.81 in women) (Table 3).
DISCUSSION
In osteoporosis feature selection by 5 ML models in the present study, the most selected variables as risk factors in men and women were BMI, monthly alcohol consumption, and dietary surveys. It is well known that chronic alcohol consumption is associated with osteoporosis and osteoporotic fractures.[15] Ethanol inhibits the differentiation and mineralization of osteoblasts, and it is reported that the risk increases as the amount of alcohol consumed increases.[16] Adequate nutritional status is also essential for maintaining proper skeletal structure.[17] The fact that adequate protein intake and low levels of serum albumin are related to the development of osteoporosis also means that nutritional status is an important factor influencing the development of osteoporosis.[18] Also, inadequate nutritional status can reduce daily activities and increase the hospitalization period and recovery time after an osteoporotic fracture.[17] Therefore, Huang et al. [19] reported that the geriatric nutritional risk index considering nutritional status and BMI is useful for assessing the risk of osteoporosis. The variables selected from ML models are traditionally well-known risk factors of osteoporosis. However, among traditionally well-known risk factors of osteoporosis, there are differences in the extent to which men and women contribute to the development of osteoporosis. Men have a lower incidence of osteoporosis than women because they basically have more bone mass than women and have a larger physique.[20] In addition, age is an important factor, especially in women, as osteoporosis increases with age after menopause.[21] It has been reported that the smoking rate of men is higher than that of women, and this difference may indicate the extent to which smoking affects the incidence of osteoporosis depending on sex.[22] Secondary osteoporosis is more common in men than women, and diabetes is one of the main causes of secondary osteoporosis.[23] In the present study, differences between men and women in osteoporosis feature selection by several ML models were age, smoking, and blood glucose level. It is surprising that ML models automatically considered such substantial male-female differences and selected them as risk factors. ML is used in various medical fields because it can learn patterns from input data and predict results considering various hidden relationships.[24] We believe that perhaps this might be a higher-dimensional process than the selection of risk factors based on expert knowledge.[25] In the current ML model, food intake (g/day), water intake (g/day), calcium intake (mg/day), and Niacin intake (mg/day) were identified as risk factors related to osteoporosis. Similar to these results, the study of Park et al. [26] showed that intake of calcium and niacin was associated with the risk of osteoporosis. Therefore, our study also suggests that careful attention to the intake of these nutritional factors will help prevent osteoporosis.
Shim et al. [27] performed osteoporosis risk prediction in postmenopausal women using 2010 and 2011 KNHNES data. A total of 7 ML models were used in their study, including the 5 used in this study. The AUC of osteoporosis prediction of their ML model varied from 0.685 to 0.743. This is lower than the AUC 0.83 to 0.88 reported in this study. On the other hand, Kwon et al. [25] performed osteoporosis risk prediction in postmenopausal women aged 40 to 69 years using the KNHNES data from 2008 to 2011, and used 3 techniques: RF, AdaBoost, and GB machine (GBM). Their reported AUCs were 0.919 for RF, 0.921 for AdaBoost, and 0.908 for GBM, which were higher than the measured values of the present study. Although there are some differences, the difference in measured AUC despite the similarity of input data and ML models is considered to be due to differences in the input data processing and selected variables. Kwon et al. [25] measured the accuracy in 3 models with different input data in ML, and different accuracy was measured for each. This means that the AUC of ML prediction can differ depending on the input data type. In particular, they argued that a small number of features is more effective than using all features in terms of model efficiency and stability in ML model. Therefore, it seems that the input of a lot of data does not necessarily guarantee the prediction of high osteoporosis. Kwon et al. [25] used medical domain knowledge alongside feature importance and recursive feature elimination techniques in the preprocessing of input data, and reported that this was a factor that improved ML training and obtained high AUC. Therefore, we believe that although the ML technique is important, the preprocessing of input data and the feature selection process are more important factors for the accuracy of the osteoporosis prediction model and will be the most important part for the success of the ML model to be developed.
This study had a few limitations. First, because the present study used the ML prediction model using cross-sectional data, it could not be confirmed whether similar results could be obtained with longitudinal data. Second, the present study could not analyze whether and how much the risk of osteoporosis could be reduced if risk factors were corrected in patients. It is considered that further research on this is needed in the future.
The clinical significance of this study is as follows. First, it is possible to provide customized algorithms for each country and race, which have been pointed out as limitations of existing fracture prediction models including fracture risk assessment tool. Through this, it will be able to serve as an important national database that enables customized osteoporosis treatment for each patient. Second, it is possible to present a customized management model necessary for osteoporosis risk management. The database, which reflects chronic diseases, nutrition, and exercise status, is representative of the population with lifestyles of a specific age group. Data on osteoporosis patients that match specific patients can be used to develop customized osteoporosis management models and programs.
In conclusion, ML performed a feature selection of osteoporosis considering hidden differences between men and women. The present study considers the preprocessing of input data and the feature selection process as well as the ML technique to be important factors for the accuracy of the osteoporosis prediction model.

 PDF Links
 PubReader
 ePub Link
 Full text via DOI
 Download Citation
 Print
Print