


INTRODUCTION
Bone mineral density (BMD) assessed using dual energy X-ray absorptiometry (DXA) plays a pivotal role in assessing fracture risk. However, more than 50% of fragility fractures occur in subjects with a normal or osteopenic range of BMD.[1] This observation implies that bone quality or microarchitecture is another determinant of bone strength as BMD accounts for only 60% to 70% of bone strength.[2] Therefore, interest in assessing the bone quality or bone microarchitecture has emerged. Several tools, such as quantitative computed tomography (QCT), high-resolution peripheral QCT, high-resolution magnetic resonance imaging, finite element analysis, and bone biopsy have been suggested.[3] However, these tools have several caveats, such as high cost, radiation exposure, invasiveness, and limited availability. Accordingly, a readily available and noninvasive bone quality assessment tool is needed to improve fracture risk assessment.
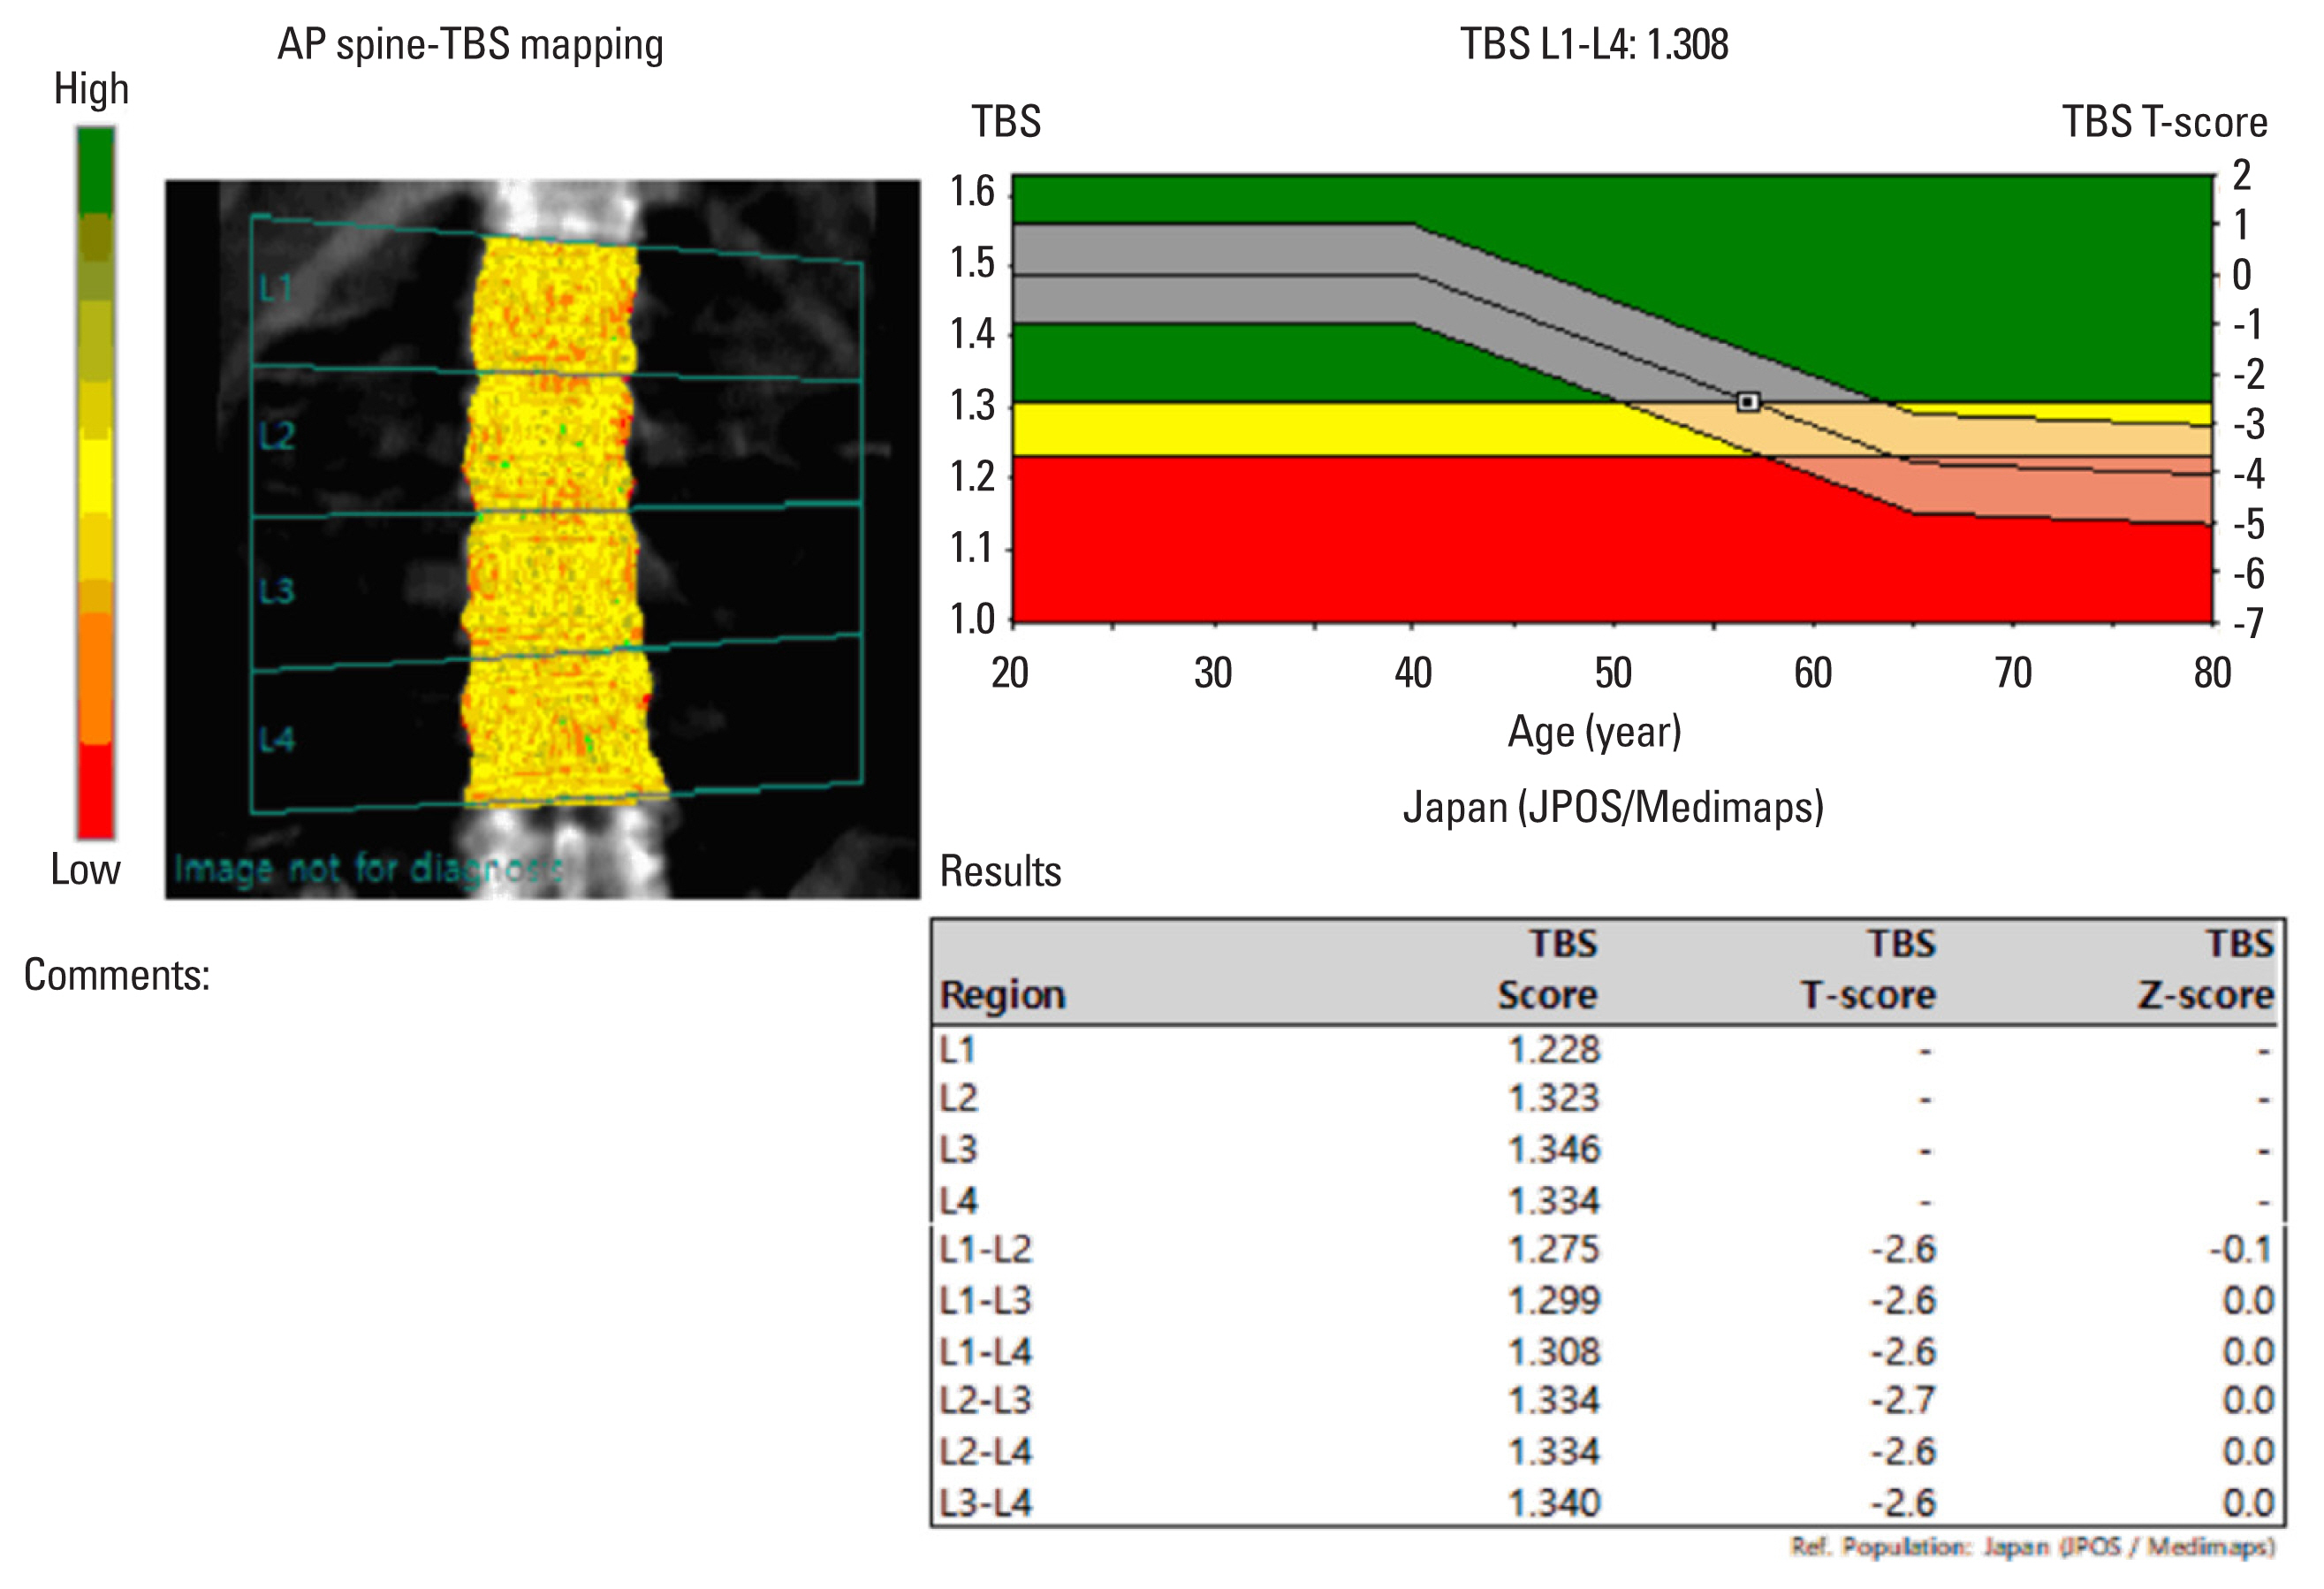
The trabecular bone score (TBS) was developed as another noninvasive imaging tool for assessing skeletal microstructure.[4] TBS is a textural index that evaluates gray-level variations in pixels in images of the lumbar spine, which is the same region of interest of the BMD derived from DXA (Fig. 1). On the projected 2-dimensional image of the 3-dimensional (3D) structure, the experimental variogram is calculated as the sum of the squared gray-level differences between pixels at a specific distance.[3] TBS is obtained from the slope of the log-log transformation of this experimental variogram.[3] High TBS values (unitless) indicate low-amplitude finely textured fluctuations.[5] Previous studies have shown that TBS is correlated with bone microarchitecture parameters such as trabecular number, trabecular thickness, connectivity, or spacing [4,6]; however, it is still unclear what exactly TBS represents.[5] Moreover, abdominal soft tissue thickness factitiously reduces TBS values, and the early version of the TBS generated lower TBS values for obese subjects and women. TBS developers upgraded the software to TBS version 4.0, which overcomes this regional soft tissue noise.[7] Recommended cut-offs in the literature are TBS >1.350 as normal; TBS between 1.200 and 1.350 as partially degraded microarchitecture; and TBS <1.200 as degraded microarchitecture.[8]
In 2012, TBS (TBS iNsight®; Med-Imaps, Pessac, France) was approved by the US Food and Drug Administration for use as a complement to DXA analysis for the assessment of fracture risk. In 2015 and 2019, the International Society for Clinical Densitometry (ISCD) published its official position regarding TBS as a non-BMD DXA measure for fracture risk prediction and monitoring.[3,9] Recently, TBS has also been approved for clinical use in Korea. At present, we have aimed to review the usefulness and limitations of TBS, and to provide valuable information on how to incorporate TBS in clinical practice.
TBS AS A FRACTURE RISK ASSESSMENT TOOL
1. TBS can be helpful in assessing vertebral, hip, and any major osteoporotic fracture risk in postmenopausal women, with further validation in the Korean population
In previous cross-sectional and prospective studies, TBS has been associated with osteoporotic fractures in postmenopausal women.[10-13] The most extensive prospective study was by Hans et al. [13] and involved the Manitoba cohort. During a mean follow-up of 4.7 years, the study reported that a decrease of 1 standard deviation (SD) in TBS was associated with a 1.22-, 1.28-, and 1.20-times increased risk of vertebral, hip, and any major osteoporotic fractures (MOF), respectively (95% confidence interval [CI], 1.10-1.34, 1.13-1.46, and 1.14-1.26, respectively). Moreover, the correlation between lumbar spine BMD and TBS was insignificant (r=0.32), while that between the lumbar spine and hip BMD was significant (r=0.72), suggesting that TBS and BMD may reflect different skeletal aspects. In another prospective study conducted in Japan, the odds ratio (OR) for vertebral fractures with 1 SD decrease in TBS was 1.98 (95% CI, 1.56-2.51) and remained significant (OR, 1.64; 95% CI, 1.25-2.15) after adjusting for BMD [14] in postmenopausal women. A combination of TBS and BMD in a single model significantly improved risk prediction accuracy than BMD alone (area under the curve [AUC], 0.73 vs. 0.673). The authors suggested that adding TBS improved the predictive ability of BMD than BMD alone.
In a meta-analysis of 17,809 participants in 14 prospective population-based cohorts, TBS adjusted for follow-up duration and age was significantly associated with MOF (gradient of risk [GR]; risk per SD of each parameter, 1.40; 95% CI, 1.30-1.52) in postmenopausal women. When additionally adjusted for Fracture Risk Assessment Tool (FRAX) 10-year probability of MOF, TBS remained an independent predictor (GR, 1.32; 95% CI, 1.24-1.41).[15] In this study, meaningful improvements in assessing the risk of MOF and hip fracture occurred when TBS was added to adjust FRAX probability. On the other hand, in a recent prospective study of 1,165 Korean women followed up over 7.5 years, BMD-adjusted FRAX and TBS-adjusted FRAX were similar in assessing MOF risk, based on Harrell’s C statistics.[16] Accordingly, in conjunction with the FRAX, TBS could improve fracture risk assessment in postmenopausal women and help guide treatment decisions; however, further validation studies in the Korean population are required. An online calculator that can include TBS and BMD values is available on the FRAX website (https://www.sheffield.ac.uk/FRAX/tool.aspx?lang=ko). A summary of cross-sectional and longitudinal studies on TBS and fracture risk in women are shown in Table 1.
2. TBS can be helpful in assessing hip and any major osteoporotic fracture risk in men aged >50 years, with further validation in the Korean population
As in postmenopausal women, TBS has been reported to be associated with osteoporotic fractures in men over 50 years old in cross-sectional and prospective studies.[15,17-19] In the Osteoporotic Fractures in Men Study (MrOS), among 5,863 American men aged 65 years and older, 448 and 181 men experienced major osteoporotic and hip fractures, respectively, over 10 years of follow-up.[19] As TBS decreased by 1 SD, the hazard ratio (HR) for MOFs increased to 1.27 (95% CI, 1.17-1.39), and the HR for hip fracture was 1.20 (95% CI, 1.05-1.39). Moreover, when TBS was added to the FRAX, 3.5% of men were correctly classified as MOF cases. The MrOS cohort study in Hong Kong reported that Chinese men with lower TBS had a higher risk of osteoporotic fracture (HR, 4.68; 95% CI, 2.11-10.41).[18] The predictive power for osteoporotic fractures was substantially improved by adding TBS to BMD; the AUC rose from 0.604 (0.562-0.646) to 0.666 (0.623-0.710), and sensitivity improved from 32.5% to 64.3%. In addition, in the Japanese population-based osteoporosis cohort study, men with MOFs had significantly lower TBS and higher FRAX scores than those without fractures.[20] In the study, TBS significantly improved the predictive power of FRAX in men over 50 years old (integrated discrimination improvement [IDI], 0.006; P=0.036; net reclassification index [NRI], 0.452; P=0.035; IDI and NRI are measurements for evaluating improvements in risk predictions). In the meta-analysis mentioned above, TBS adjusted for follow-up duration and age showed an association with MOF (GR, 1.50; 95% CI, 1.36-1.66) in men.[15] The association remained significant after FRAX 10-year probability was adjusted (GR, 1.35; 95% CI, 1.21-1.49). These studies confirmed an independent association between TBS and major osteoporotic and hip fractures in men, but as in postmenopausal women, further validation studies in Korean men are required. A summary of cross-sectional and longitudinal studies regarding TBS and fracture risk in men is shown in Table 2.
THE ROLE OF TBS IN INITIATING TREATMENT AND MONITORING TREATMENT RESPONSE
2. TBS can be used along with BMD and FRAX to adjust for the FRAX-probability of fracture in postmenopausal women and men over 50 years old, with further validation in the Korean population
Currently, there is no evidence supporting the use of TBS alone to guide initiation of treatment, which has also been noted in the recent ISCD position statement.[3] A clinical threshold of TBS that can be used to initiate anti-osteoporotic medications has not yet been established.
TBS can be used to adjust for the FRAX-probability of fracture in association with FRAX and BMD. In the Manitoba registry from Canada including 33,352 women aged 40 to 100 years (mean age, 63; 1 or more MOF in 1,872 women over a mean of 4.7 years), each SD reduction in TBS was associated with an 18% and 23% increase in MOF and hip fracture risk, respectively, after adjusting for femoral neck BMD and clinical risk factors.[12] Based on this study, a TBS-adjusted FRAX model for MOF and hip fracture probability was derived and applied to the FRAX website from April 2014.[21] The impact of TBS adjustment was more marked in younger women and women with lower BMDs. Results from an individual-level meta-analysis of 17,809 men and women from 14 prospective cohorts (mean, 6.1 years of follow-up) showed a small increase in the GR of MOF (1.76 vs. 1.70) and hip fracture (2.25 vs. 2.22) when FRAX was adjusted with TBS, and was similar between men and women.[15] Although these data suggest the utility of TBS as an adjunctive test to BMD and FRAX to enhance the FRAX-probability of fracture, further validation is needed on whether TBS-adjusted FRAX can improve fracture prediction compared to unadjusted FRAX in the Korean population. In a community-based cohort of Korean women (1,165 women aged 45-76, MOF in 8.5% during 7.5 years of follow-up), each percent increment in unadjusted, BMD-adjusted, and TBS-adjusted FRAX probability for MOF was associated with the risk of MOF (HR, 1.08, 1.09, and 1.07, respectively).[16] However, TBS-adjusted FRAX did not improve fracture prediction than unadjusted FRAX in terms of Harrell’s C statistics. Further studies are suggested for research agendas, including the clinically applicable thresholds of TBS-adjusted FRAX probabilities in Koreans, additional assessment of the GR by TBS adjustment in larger, representative cohorts, and testing for calibration of TBS-adjusted FRAX probabilities.
3. The available evidence does not support routine monitoring of TBS in patients on antiresorptive agents
The least significant change (LSC) calculated using the precision of TBS is crucial for evaluating the value of repeated TBS testing for therapeutic monitoring. TBS LSC varied from 3.1% to 5.8% among facilities in previous studies, which was slightly worse than that of lumbar spine BMD.[9]
Table 3 summarizes the changes in TBS with antiresorptive agents. In patients who received oral antiresorptive treatment including alendronate, risedronate, and ibandronate, TBS increment was minimal (+0.2% [SD, 1.9] to +1.4% [SD, 6.6] per year) and well below the TBS LSC.[22,23] In line with these findings, a study of postmenopausal Korean women (N=191; mean age, 69.2 years) who were treated with oral alendronate, risedronate, or intravenous (IV) ibandronate reported an increased TBS of +0.33% (SD, 1.96) at 12 months.[24] Changes in TBS with antiresorptive therapy (bisphosphonate 80%) did not predict incident fractures in 9,044 women aged 40 years or older in the Manitoba DXA registry.[25] Three-year data from the HORIZON trial showed that mean changes in TBS at 36 months were +1.41% (SD, 0.79) in patients who received zoledronic acid 5 mg annually, without any significant gain in TBS in 65% of treated patients.[26] In a subgroup analysis of the FREEDOM trial comparing denosumab 60 mg (N=157) to placebo (N=128), the mean increase in TBS in the denosumab group was +2.4% at 36 months, and 80% of patients did not have increased TBS beyond the LSC.[27] Given that more than half the patients who received antiresorptive treatment - irrespective of potency and route - did not have an increase in TBS beyond the LSC despite an increase in BMD and fracture risk reduction, TBS would not be useful for monitoring patients on antiresorptive agents during the treatment period up to 3 years. It remains to be investigated if a more extended time interval might be necessary to detect significant TBS increase beyond LSC in patients on antiresorptive treatment.
4. TBS has the potential to improve anabolic response monitoring in addition to BMD measurements
The change in TBS with anabolic agents is shown in Table 3. In a study comparing teriparatide 20 mcg daily (N=65) with IV ibandronate 3 mg every 3 months (N=122) in postmenopausal women, the teriparatide group had a significantly larger gain in TBS compared to ibandronate (+4.3% vs. +0.3%) and larger lumbar spine BMD gain (+7.6% vs. +2.9%), at 24 months, showing TBS increase beyond LSC in 62% of patients in the teriparatide group.[28] Teriparatide treatment also increased TBS in patients with glucocorticoid-induced osteoporosis (+3.7%) at 36 months, whereas TBS remained unchanged in alendronate-treated patients at any time point compared to baseline.[29] Additionally, an abaloparatide (N=24) 80 μg-daily group yielded more robust gain in TBS than teriparatide (N=31) 20 mcg-daily group (+4.2% vs. +2.2%) at 24 weeks in a post-hoc analysis of phase 2 trials (postmenopausal women aged 55-85 years); however, abaloparatide is not yet available in Korea.[30] These data indicate that anabolic drugs, such as teriparatide or abaloparatide, may have more pronounced and favorable effects on bone microarchitecture within a relatively short period than bisphosphonates. Data on the effect of romosozumab on TBS changes are still lacking, which remains one of the research areas.
USEFUL CONDITIONS OF TBS
1. In postmenopausal women with type 2 diabetes mellitus, TBS is associated with major osteoporotic fracture risks
2. TBS can be useful in evaluating bone status in subjects with several medical conditions, but there is a lack of evidence on whether TBS predicts fracture risk in addition to BMD
Since TBS utilizes previously obtained images from DXA with a wealth of cross-sectional and longitudinal data, accuracy is one of its advantages. Studies have also demonstrated the advantages of evaluating and monitoring patients with certain conditions, such as type 2 diabetes mellitus (T2DM),[11,31-33] glucocorticoid-induced osteoporosis,[34,35] primary hyperparathyroidism (PHPT),[36-40] chronic kidney disease (CKD),[41-43] and subclinical and overt Cushing syndrome.[44,45] In addition, other conditions such as acromegaly,[46,47] rheumatoid arthritis,[48-50] osteoarthritis,[51,52] spondyloarthritis,[53-55] thyroid-stimulating hormone suppression,[56-58] and the use of aromatase inhibitors,[59,60] have been reported to be associated with decreased TBS (Table 4). However, conditions other than T2DM have been studied only in a small number of participants and fracture events, which is insufficient to recommend the use of TBS for assessing fracture risk.
3. Type 2 diabetes mellitus
In a retrospective study by Leslie et al. [11], women with T2DM had higher lumbar spine BMD but lower TBS than nondiabetic women at baseline. During the 4.7 years of follow-up, MOF events occurred more frequently in women with T2DM. Additionally, TBS was associated with higher fracture risk in women with and without T2DM (HR, 1.27; 95% CI, 1.10-1.46; and HR, 1.31; 95% CI, 1.24-1.38, respectively). In a study from the Korean Ansung cohort, Kim et al. [31] reported that TBS was significantly lower in men and women younger than 65 years with T2DM than in those without. In this study, TBS was inversely associated with HbA1c and the homeostatic model assessment for insulin resistance, indicating that the modality could be utilized to understand the paradoxically increased BMD in T2DM patients. In another study in patients with T2DM, patients with vertebral fractures had lower TBS than those without fractures, and TBS per 1 SD decrease had increased odds for fracture (OR, 1.80; 95% CI, 1.10-2.70).[32] In a recent meta-analysis, patients with T2DM had lower TBS than those without, with a mean difference of −0.31 (95% CI, −0.45 to −0.16),[33] fortifying the previous results. Therefore, TBS is a parameter that can be useful in explaining the excess risk of fracture in T2DM patients.
4. Glucocorticoid-induced osteoporosis
In a study by Paggiosi et al. [34], glucocorticoid-treated women had lower TBS than untreated women (Z-scores, −0.8 vs. 0) but had similar BMDs. TBS alone could discriminate between glucocorticoid-treated and untreated women (AUC, 0.721), while BMD alone could not (AUC, 0.572). In another study by Florez et al. [35] in patients treated with long-term glucocorticoids, TBS was better able to discriminate patients with fracture than BMD, especially vertebral fractures (AUC, 0.73), suggesting the future utility of TBS as a complementary tool in assessing the risk of fracture in patients with glucocorticoid-induced osteoporosis.
5. Primary hyperparathyroidism
PHPT has also been reported to be associated with TBS in previous studies. In a cross-sectional study by Romagnoli et al. [36], patients with PHPT had lower TBS than healthy postmenopausal women (1.19±0.10 vs. 1.24±0.09; P<0.01). Within PHPT patients, TBS could discriminate between those with and without vertebral fracture (AUC, 0.716; 95% CI, 0.590-0.841). In another cross-sectional study by Hong et al. [39], TBS was decreased in PHPT patients when compared to the controls (1.280±0.131 vs. 1.372±0.276; P=0.021), but lumbar spine BMD was similar (P=0.653). However, there was no difference in TBS in relation to vitamin D deficiency among patients with PHPT.[40] In a prospective observational study, baseline TBS was lower in patients with PHPT than in healthy controls (Z-score, −2.39± 1.79 vs. −0.98±1.07; P<0.01), and had an association with the odds of vertebral fracture (OR, 1.4; 95% CI, 1.1-1.9). Moreover, after parathyroidectomy, TBS increased by 47.0±44.8% over a year,[61] as reported in other studies.[37] Therefore, TBS may provide information towards the decision to recommend surgery, according to the Fourth International Workshop of Asymptomatic PHPT.[38]
6. CKD
CKD is a well-known risk factor for osteoporotic fractures.[41,42] The utility of BMD in assessing the risk of fractures has been inconsistent. Meanwhile, few studies on the effect of CKD on bone microarchitecture have been reported. Naylor et al. [43] reported that patients with CKD (eGFR <60 mL/min per 1.73 m2) and lower TBS (<1.277, the median) had a higher 5-year probability of fracture than those with higher TBS (HR, 1.62; 95% CI, 1.04-2.51). Consistent with other studies, lower TBS was independently associated with a higher risk of fracture while BMD was not,[62-64] implicating that CKD may affect the bone microarchitecture assessed by TBS.
7. Subclinical and overt Cushing syndrome
Cortisol excess is known to be associated with an increased risk of fracture, independent of BMD.[44] Several studies have investigated the association between cortisol excess and bone microarchitecture. Eller-Vainicher et al. [45] reported that patients with subclinical hypercortisolism had lower TBS than healthy controls (Z score, −3.18±1.21 vs. −1.19±0.99; P<0.01). Moreover, patients with low TBS were likely to experience fractures within 24 months (OR, 11.20; 95% CI, 1.71-71.41; P=0.012) after adjusting for age, body mass index (BMI), and baseline lumbar spine BMD. Moreover, Kim et al. [65]. recently reported that patients with subclinical hypercortisolism had a 2.2% lower TBS than those with nonfunctioning adrenal incidentalomas (P=0.040). A deteriorated bone microstructure (TBS <1.230) was also associated with the serum cortisol level after a 1 mg dexamethasone suppression test (OR, 2.18; 95% CI, 1.04-4.53).[65] In another study including both patients with overt and subclinical Cushing syndrome, TBS, but not BMD values, decreased with the degree of hypercortisolism (P<0.01). In addition, after remission of Cushing syndrome, TBS markedly improved when compared to BMD (10% vs. 3%; P<0.02).[66] Accordingly, TBS might be a potential parameter to explain fracture risks in patients with cortisol excess, with further prospective studies.
LIMITATIONS OF TBS
1. High BMI and soft tissue thickness can attenuate the negative correlation of TBS, but this can be overcome by using an upgraded version of the TBS algorithm
In a study by Shin et al. [67] on 1,505 Korean women aged ≥40 years, 160 subjects with high BMI were found to have a more degraded TBS than BMD. Leslie et al. [68] reported that among 29,407 women ≥50 years, obese subjects with BMI over 30 kg/m2 had a negative correlation with TBS. According to the manufacturer, BMI between 15 and 37 kg/m2 is reliable for TBS analysis.
Kim et al. [69] reported that relatively visceral fat might have a more detrimental effect on TBS than subcutaneous fat. Moreover, Amnuaywattakorn et al. [70] demonstrated that increased soft-tissue thickness resulted in lower TBS values. The DXA image became fuzzier as soft tissue thickness increases, as the soft tissue act like a blurring filter. Therefore, variations among the image pixels decreases which leads to lowered TBS value.[70] Although BMD is affected by soft tissue thickness, it does not cause a clinical problem because these changes do not exceed LSC. An updated version of the TBS version 4.0 algorithm tested by Shevroja et al. [7] was found to overcome this residual negative correlation of the current TBS with body size and composition parameters and is suggested to be free from previously acknowledged technical limitations.
There were sex and ethnic differences in TBS. The older software versions were optimized only for women, and the TBS value using the old version was higher in women than in men. Therefore, TBS version 2.1 and above should be used in men.[71] TBS was higher in non-Hispanic white women and lower in non-Hispanic black and Mexican-American women.[5] The TBS reference range has also been applied only to postmenopausal women. In addition, since there is a lack of a well-established cut-off point for TBS, a large population study would be required to determine the optimal ranges across age and sex.[8]
2. There are several technical issues that affect the results of TBS
Gray-level variations related to vertebral shape and size, heterogeneity among the detectors in the DXA machine, and image noise can be superimposed on those gray-level variations related to the microarchitecture. The CaMos study [72], a Canada-wide population-based prospective cohort study, demonstrated that lumbar spine TBS and BMI showed a significant negative correlation using only Hologic, but not GE-Lunar densitometers. For clinical and research applications, TBS using DXA densitometers from different manufacturers should be gathered for analysis.
TBS values were reduced by image noise, regardless of the pixel size considered, and contributed to the degradation of resolution. Winzenrieth et al. [73] demonstrated that the average value of TBS decreased when noise was added. However, it did not significantly affect the correlation between TBS and 3D parameters. Accordingly, DXA scanners should be preserved within normal conditions, and causes of inappropriate noise such as aging X-ray tubes and sensor deficiencies should be managed.
In terms of DXA scan modes, the reproducibility of TBS was lower than that of BMD, but differences between the 3 DXA scan modes, such as fast-array, array, and high-definition, were not significant in terms of TBS.[74] The difference in reproducibility among the 3 scan modes was not significant for either BMD or TBS (P=0.942). We have summarized the limitations of TBS in Table 4.
CONCLUSION: OPTIMIZING TBS IN CLINICAL PRACTICE
TBS has an additional role apart from BMD in assessing osteoporotic fracture risk and clinical risk factors in postmenopausal women and men over 50 years old and has been supported by several studies. Thus, TBS may be applied to assess fracture risk and to adjust the FRAX probability of fracture, which determines treatment initiation. TBS alone was not sufficient to initiate treatment or monitor the effect of antiresorptive agents. However, TBS can be helpful in monitoring the response to anabolic agents. The recently upgraded version TBS version 4.0 can overcome the technical limitations of soft tissue interference. By understanding the advantages and limitations of TBS, we can optimize the use of TBS in clinical practice.
 PDF Links
 PubReader
 ePub Link
 Full text via DOI
 Full text via PMC
 Download Citation
 Print
Print