Relationship between Decrease in Serum Sodium Level and Bone Mineral Density in Osteoporotic Fracture Patients
Article information
Abstract
Background
Recently, it has been suggested that decrease in serum sodium level is associated with osteoporosis. However, no study in Korea has reported the association of decrease in serum sodium level with osteoporosis. In this study, we investigated the relationship between the decrease in serum sodium level and severity of osteoporotic fracture in patients.
Methods
We enrolled 290 subjects who were admitted and operated at Soonchunhyang University Hospital due to major fractures. For the control group, we enrolled 1,027 subjects who visited a health promotion center. We carried a 1:1 matching with age and sex from the case group.
Results
In a total of 164 age- and sex-matched subjects, serum sodium level was significantly lower in the fracture group than in the non-fracture group (P=0.001). Serum sodium level was significantly lower in the severe osteoporosis group than that in the non-severe osteoporosis group (P=0.002). Old age and decrease in serum sodium level were independent risk factors of osteoporosis (odds ratio [OR]=1.088, P=0.008, confidence interval [CI]=[1.022-1.157]; OR= 0.840, P=0.037, CI=0.713-0.989).
Conclusions
Serum sodium level was significantly lower in the fracture group than that in the non-fracture group and in the severe osteoporosis group than that in the non-severe osteoporosis group. Based on our results, the decrease in serum sodium level could be an independent risk factor for osteoporosis.
INTRODUCTION
Osteoporosis is a major factor of bone fracture. Hip fracture in elderly patients deteriorates their quality of life and increases their morbidity and mortality.[1] According to a previous study, 13.5% of hip fracture patients died within 6 months, and 24% died within one year.[2] Hyponatremia defined as lower than 135 mmol/L of the serum sodium level is one of the most common metabolic disorders,[3] particularly in elderly patients. Its incidence rate ranges from 7% to 53%.[4] Hyponatremia is known to increase morbidity and death rates.[5] Its effect on bone metabolism have been reported.[6,7,8] Hyponatremia increases urinary sodium excretion. It causes activation of bone absorption, making bone vulnerable, which eventually causes osteoporosis.[7] In addition, hyponatremia can induce mild damage in cognitive function, which can result in unstable walking, causing fall and osteoporotic fractures.
So far, only a few studies have reported the relationship between osteoporosis and hyponatremia. Recently, Park et al.[9] reported that 24 hr urinary sodium excretion had a positive correlation with 24 hr urinary calcium excretion associated with increased biochemical markers of bone resorption. Therefore, low serum sodium level might be associated with high 24 hr urinary sodium excretion, which could induce increased bone resorption. The purpose of this study was to determine the relationship between serum sodium level and severe osteoporosis, especially in patients with hip fracture.
METHODS
1. Subjects
Of 410 adult patients who underwent surgeries due to fractures (femoral intertrochanteric fracture, femoral neck fracture, vertebral compression fracture, and spine burst fracture) in Soonchunhyang University Hospital between January 2012 and March 2014, 57 high-energy damage patients such as 28 motor vehicle accident patients, 21 patients who fell from a height higher than 1.8 m, and 8 compression damage patients were excluded from the study. In addition, 30 patients who did not undergo bone mineral density (BMD) test to confirm osteoporosis [10] were excluded. In addition, 18 chronic renal insufficiency patients with the possibility of osteoporosis who were on dialysis, 6 patients who were on steroids due to Cushing's disease, adrenal deficiency, or rheumatoid arthritis, and 2 multi-metastasized malignant tumor patients with high risk of pathologic fracture were also excluded from this study.[11] Finally, a total of 290 subjects (65 males and 223 females) who were 50 or older were selected as the patient group. Of 6,507 patients who visited Soonchunhyang University Hospital Health check-up Center between January 2011 and March 2014, 3,042 subjects who were 50 years or older were screened. Of them, 1,459 patients who missed tests including the glycated hemoglobin test, 160 diabetes patients whose glycated hemoglobin level was 6.5% or higher, 261 patients who had a history of hypertension, and 135 repeatedly visited patients were excluded. Finally, a total of 1,027 patients (507 males and 520 females) who were 50 years or older were selected as the control group.
To determine the correlation between age and gender, both of which are known osteoporosis factors, patient group's age and gender were 1:1 matched to establish the control group. Finally, the patient group with 82 subjects and the control group with 82 subjects were analyzed.
2. Methods
1) BMD
BMD test was conducted using dual energy X-ray absorptiometry (DXA; GE Lunar, Medison, WI, USA) when patients visited the hospital. If the test was not conducted upon admission but the test was conducted in the last one month, the test results were used in the study. The test site was the central bone (the lumbar vertebrae and proximal femur). Pelvic and anteroposterior radiographic images were confirmed to exclude fracture sites. In the case of fracture, the other side was used.
The lowest T-scores of the lumbar spine and proximal femur were used to determine osteoporosis. Based on the World Health Organization (WHO) criteria, the T-score up to -1 was defined as normal; from lower than -1 to higher than -2.5 was defined as osteopenia; and -2.5 or lower was defined as osteoporosis. When the T-value was -2.5 or lower accompanied with osteoporotic fracture, the case was classified as severe osteoporosis.[12]
2) Serum sodium
Serum sodium level was measured upon admission through blood test. In the electrolyte test, the serum sodium level of 135 mmol/L or higher was classified as normal; from 130 mmol/L or higher to lower than 135 mmol/L was classified as mild hyponatremia; and lower than 130 mmol/L was classified as moderate hyponatremia.[13,14]
3) Serum glucose
All blood tests were based on the blood collected at the time of admission. The patient group's serum glucose level was the fasting serum glucose level after their admission. The fasting blood test of the control group was conducted when they visited the Health Examination Center. The fasting blood test of the patient group was conducted mostly when they were moved to the Emergency Room after they were injured. To correct this difference, an additional fasting serum glucose test was conducted within one week after admission.
4) Statistical analysis
Results were expressed as mean±standard deviations (SDs). Greedy algorithm was used as a match-up method. Clinical features of the patient group and control group were analyzed. Age, body mass index (BMI), height, and BMD level of the two groups were compared using Student's t-test. Body weight the levels of blood urea nitrogen, creatinine, albumin, fasting serum glucose, and blood sodium were compared using Mann-Whitney U-test. Statistical significance was considered when P value was less than 0.05. For comparisons of categorical variables, the χ2 test and Fisher's exact test were used. To determine whether the decrease in the serum sodium level was an independent risk factor for osteoporosis, logistic regression analyses were conducted. SPSS Version 18.0 (SPSS Inc., Chicago, IL, USA) was used for statistical analyses.
RESULTS
Basic clinical manifestations of the whole population (290 patient group subjects with fracture and 1,027 control group subjects without fracture) were confirmed (Table 1). Since the patient group population with fracture was significantly older with a higher female ratio than the control group population without fracture, age and gender were corrected by 1:1 match-up. As a result, the fractured patient group with 82 subjects and the non fractured control group with 82 subjects were prepared (Table 2). In the matched control group, the mean age was 67.2 years, including 65.9% females. Of them, 99 patients were diagnosed with osteoporosis. Four patients had hyponatremia (2 in mild hyponatremia and 2 moderate hyponatremia) (Table 3). Fracture sites in the patient group included intertrochanteric fracture (n=26), femoral neck fracture (n=34), vertebral compression fracture (n=21), and vertebral burst fracture (n=1). Compared to the control group, the fractured patient group had significantly lower level of serum albumin, fasting serum glucose, serum sodium, and BMD (Table 2).
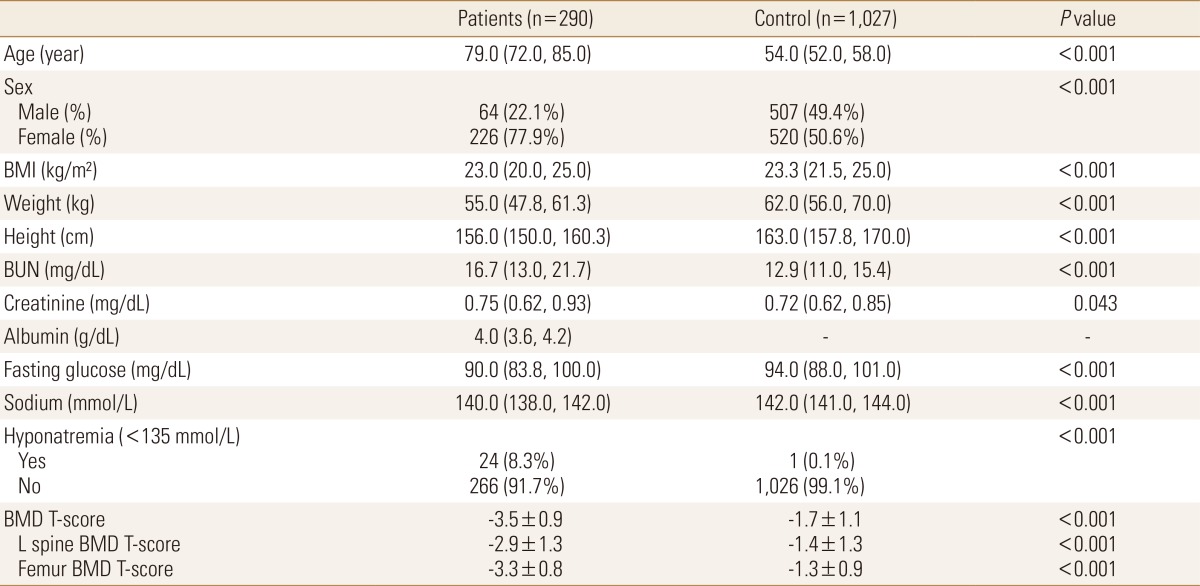
Baseline characteristics of the total population (n=1,317)
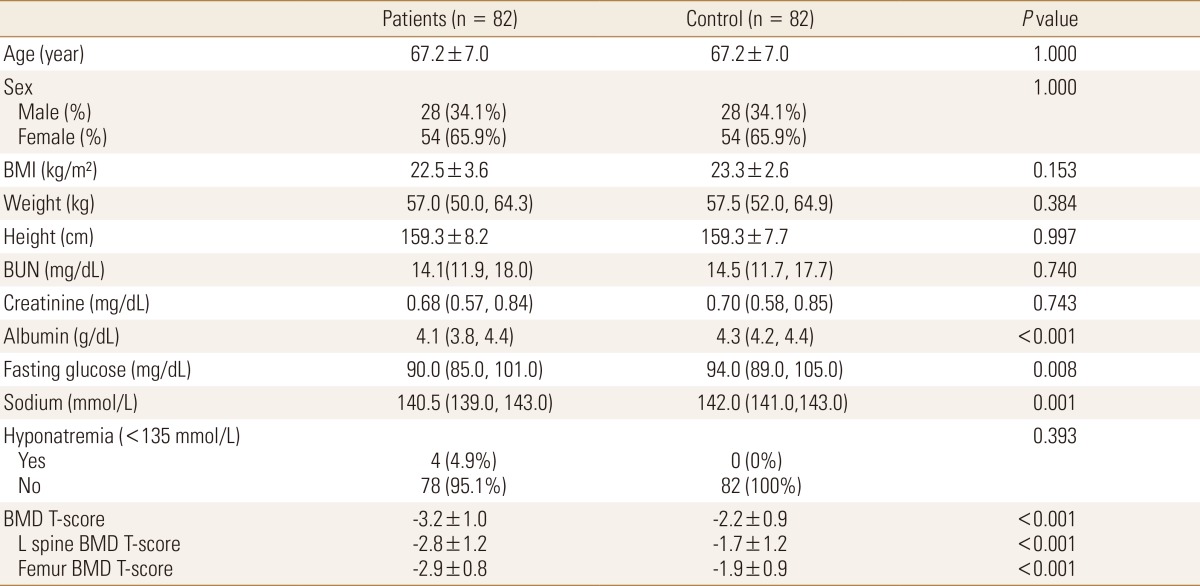
Baseline characteristics of the age- and sex- matched population (n=164)
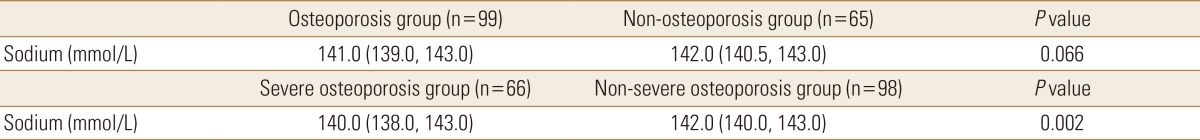
Correlation of serum sodium and osteoporosis in age- and sex- matched population (n=164)
For serum sodium level, of the 99 osteoporosis subjects, two were in the range of 121 to 125 mmol/L serum sodium, no subject had level of 126 to 130 mmol/L, 5 subjects had level of 131 to 135 mmol/L, 33 subjects had level of 136 to 140 mmol/L, and 59 subjects had level of 141 mmol/L or higher. In the 55 non osteoporosis subjects, 16 subjects had serum sodium level in the range of 136 to 140 mmol/L, and 49 subjects had serum sodium level of 141 mmol/L or higher. This meant that all hyponatremia subjects showed osteoporosis (Fig. 1). These results were similar to those of the whole group population of 1,317 which was composed of the fracture group population of 290 and the non fractured control group population of 1,027 (Fig. 2).
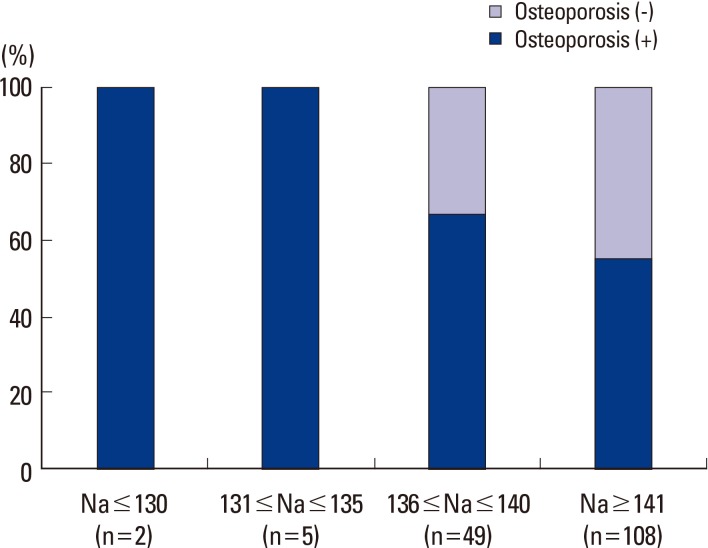
Distributions of serum sodium and osteoporosis for age-and sex-matched population (n=164).
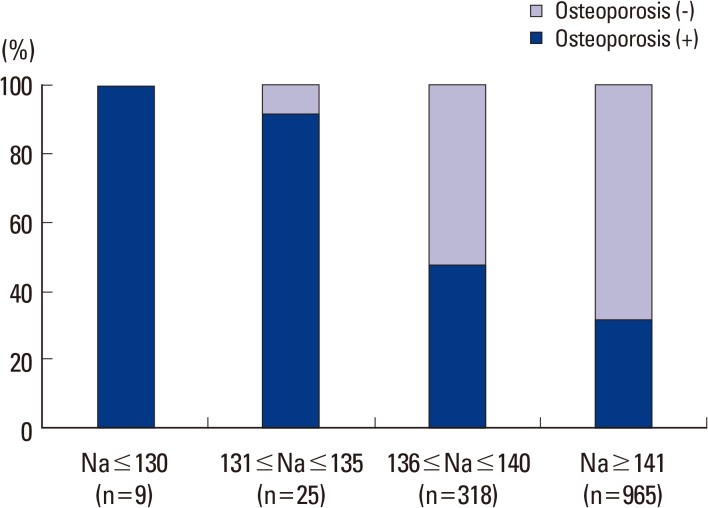
Distributions of serum sodium and osteoporosis for total population (n=1,317).
In the 99 osteoporosis patients and 65 non-osteoporosis patients whose age and gender were corrected and matched at 1:1, the osteoporosis group had lower blood sodium level than the non-osteoporosis group. However, the difference was statistically insignificant (141.0 mmol/L [139.0, 143.0] vs. 142.0 mmol/L [140.5, 143.0], P=0.066). In the meantime, the severe osteoporosis group (66 subjects) showed a significantly lower blood sodium level than the group without severe osteoporosis (98 subjects) (140.0 mmol/L [138.0, 143.0] vs. 142.0 mmol/L [140.0, 143.0], P=0.002) (Table 3). Values were presented as medians [25th, 75th percentiles]. Sodium levels were analyzed using the Mann-Whitney U-test because they did not follow a normal distribution (Fig. 3).
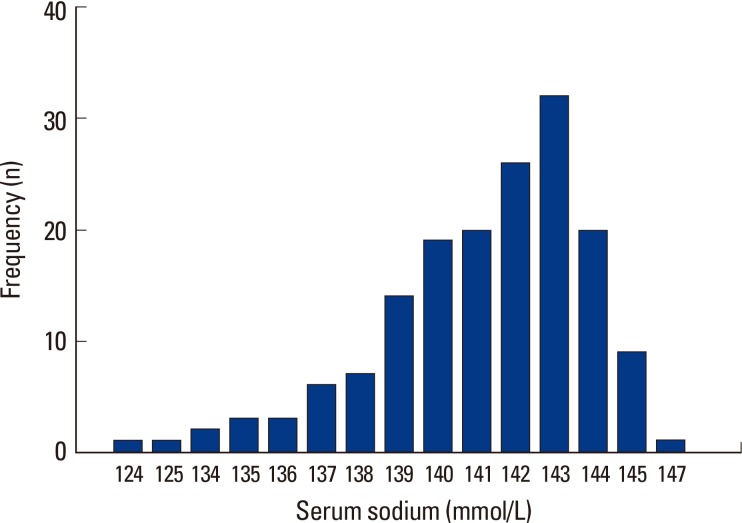
Frequency analysis for serum sodium level (n=164).
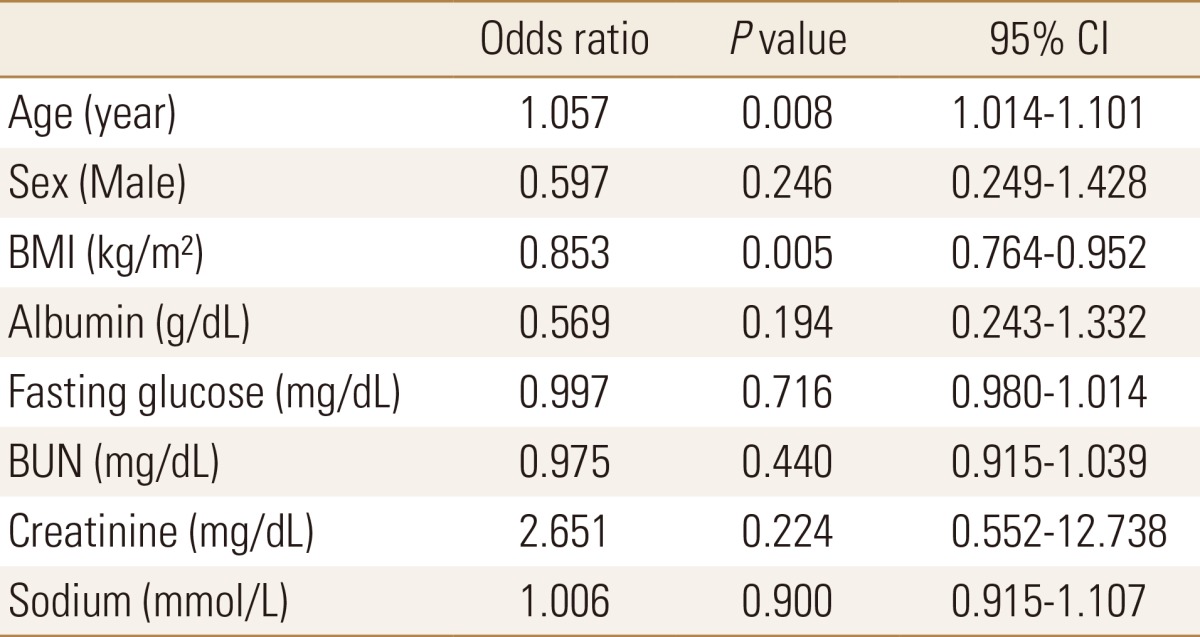
To determine whether hyponatremia was an independent risk factor for osteoporosis, logistic regression analyses were conducted. The whole population of 1,317 (comprised the fracture group population of 290 and the non fracture control group population of 1,027) were analyzed. As a result, the risk for osteoporosis was significantly increased with the increase in age and with the decrease in BMI. Increase in age and decrease in BMI were confirmed as statistically significant independent risk factors for osteoporosis in this study (odds ratio [OR]=1.057, P=0.008, 95% confidence interval [CI]=[1.014-1.101]; OR=0.853, P=0.005, CI=[0.764-0.952], respectively) (Table 4).
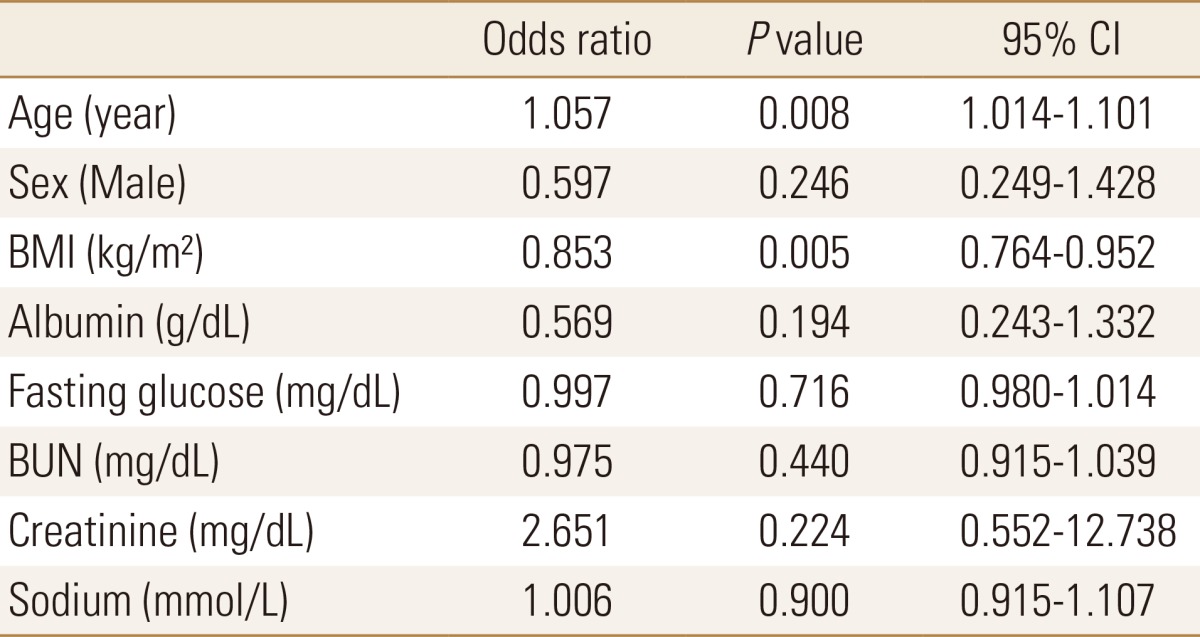
Logistic regression analyses of osteoporosis risk factors for the total population (n=1,317)
Logistic regression analyses were also conducted for the 164 subjects whose age and gender were 1:1 matched. As a result, the risk of osteoporosis was also significantly increased with the increase in age and with the decrease in serum sodium level. This meant that the increase in age and the decrease in serum sodium level were statistically significant independent risk factors for osteoporosis (OR=1.088, P=0.008, 95% CI=[1.022-1.157]; OR=0.840, P=0.037, 95% CI=[0.713-0.989], respectively) (Table 5).
Logistic regression analyses of osteoporosis risk factors for the age-and sex- matched population (n=164)
DISCUSSION
Osteoporosis is a systemic disease that causes damages in the bone strength, thus increasing fracture risk. Osteoporotic fractures occur in the spine, femur, radius, ulnar, and proximal humerus due mainly to falls or minor trauma.[15] The fracture causes troubles in activities of daily life. Osteoporosis and decreased BMD are significantly associated with the quality of life.[16] Osteoporotic fractures account for 40% of all fracture cases.[17]
Hyponatremia is the most common electrolyte disorder observed in hospitals. At the time of admission, its incidence rate is 2-4%. However, it increases up to 5% during hospital stay.[18] Particularly, elderly patients with hyponatremia show a higher frequency than other patient groups.[4]
Considering that both osteoporotic fracture and hyponatremia are common, confirmation on their correlation and prevention of these diseases may be necessary in socioeconomic aspects. In this study, the effect of the decrease in serum sodium level on BMD deterioration was confirmed and their proportional tendency with the severity was investigated. Serum sodium level of the fracture patient group was significantly lower than that of the control group. Serum sodium level of the osteoporosis group was also lower than that of the non-osteoporosis group, although the difference was statistically insignificant. Serum sodium level of the severe osteoporosis group was lower than that of the group without severe osteoporosis.
Known risk factors of osteoporosis include old age, use of steroids, low weight, low BMI (<19), type 1 diabetes, primary hyperparathyroidism, hyperthyroidism, organ transplantation, chronic kidney failure, and Cushing's disease.[19] In this study, increase in age and low BMI were statistically significant risk factors of osteoporosis in the whole population. In the group whose age and gender were corrected, the increase in age and decrease in the blood sodium level were statistically significant independent risk factors.
The significance of this study is that we confirmed the association between osteoporosis and hyponatremia or serum sodium reduction. This approach has been rare in Korea. Considering that the ethnic group is recently included as one of the risk factors of osteoporosis,[19] this study may be meaningful for Korean patients.
There are some limitations of this study. First, the possibility of temporary hyponatremia was not excluded. Considering the outcomes of previous studies, the osteoporosis risk is increased when chronic hyponatremia is accompanied.[7] In this study, serum sodium level at the time of admission was used. Accordingly, the possibility of temporary hyponatremia at the time of measurement could not be excluded. Second, since the subjects had fractures already, their osteoporosis status was all severe. Osteoporosis accompanied with fracture is classified as severe osteoporosis.[12] Accordingly, the patient group in this study was composed of osteoporosis patients severer than usual osteoporosis patients. Finally, this was a retrospective study. In medical records, some information that could be used as risk factors of osteoporosis[19] such as smoking, alcohol intake, and menopause was missing. Under these conditions, the risk factors were corrected prior to forming patient groups to enhance the accuracy of this study. As a result, the size of the final subjects was decreased. In future study, follow-up tests for serum sodium level may be necessary using chronic hyponatremia group and larger size group for the analyses according to the severity of osteoporosis. In addition, prospective studies may be necessary to control the influence factors and enhance data completeness. The effect of hyponatremia or decreased serum sodium level on bone metabolism and the effect of corrected hyponatremia on the quality of life may also be necessary in the future to improve the prognoses and the quality of life in hyponatremia fracture patients.
CONCLUSIONS
Our study revealed that serum sodium levels were significantly lower in the fracture group and severe osteoporotic patients. Therefore, decreased serum sodium level is possibly another independent risk factor for osteoporosis related fracture.
Notes
No potential conflict of interest relevant to this article was reported.