Cross-Sectional and Longitudinal Associations between Forearm Bone Mineral Density and Anthropometry in Adult Japanese Men and Women
Article information

Abstract
Background
No consensus exists regarding which anthropometric measurements are related to bone mineral density (BMD), and this relationship may vary according to sex and age. A large Japanese cohort was analyzed to provide an understanding of the relationship between BMD and anthropometry while adjusting for known confounding factors.
Methods
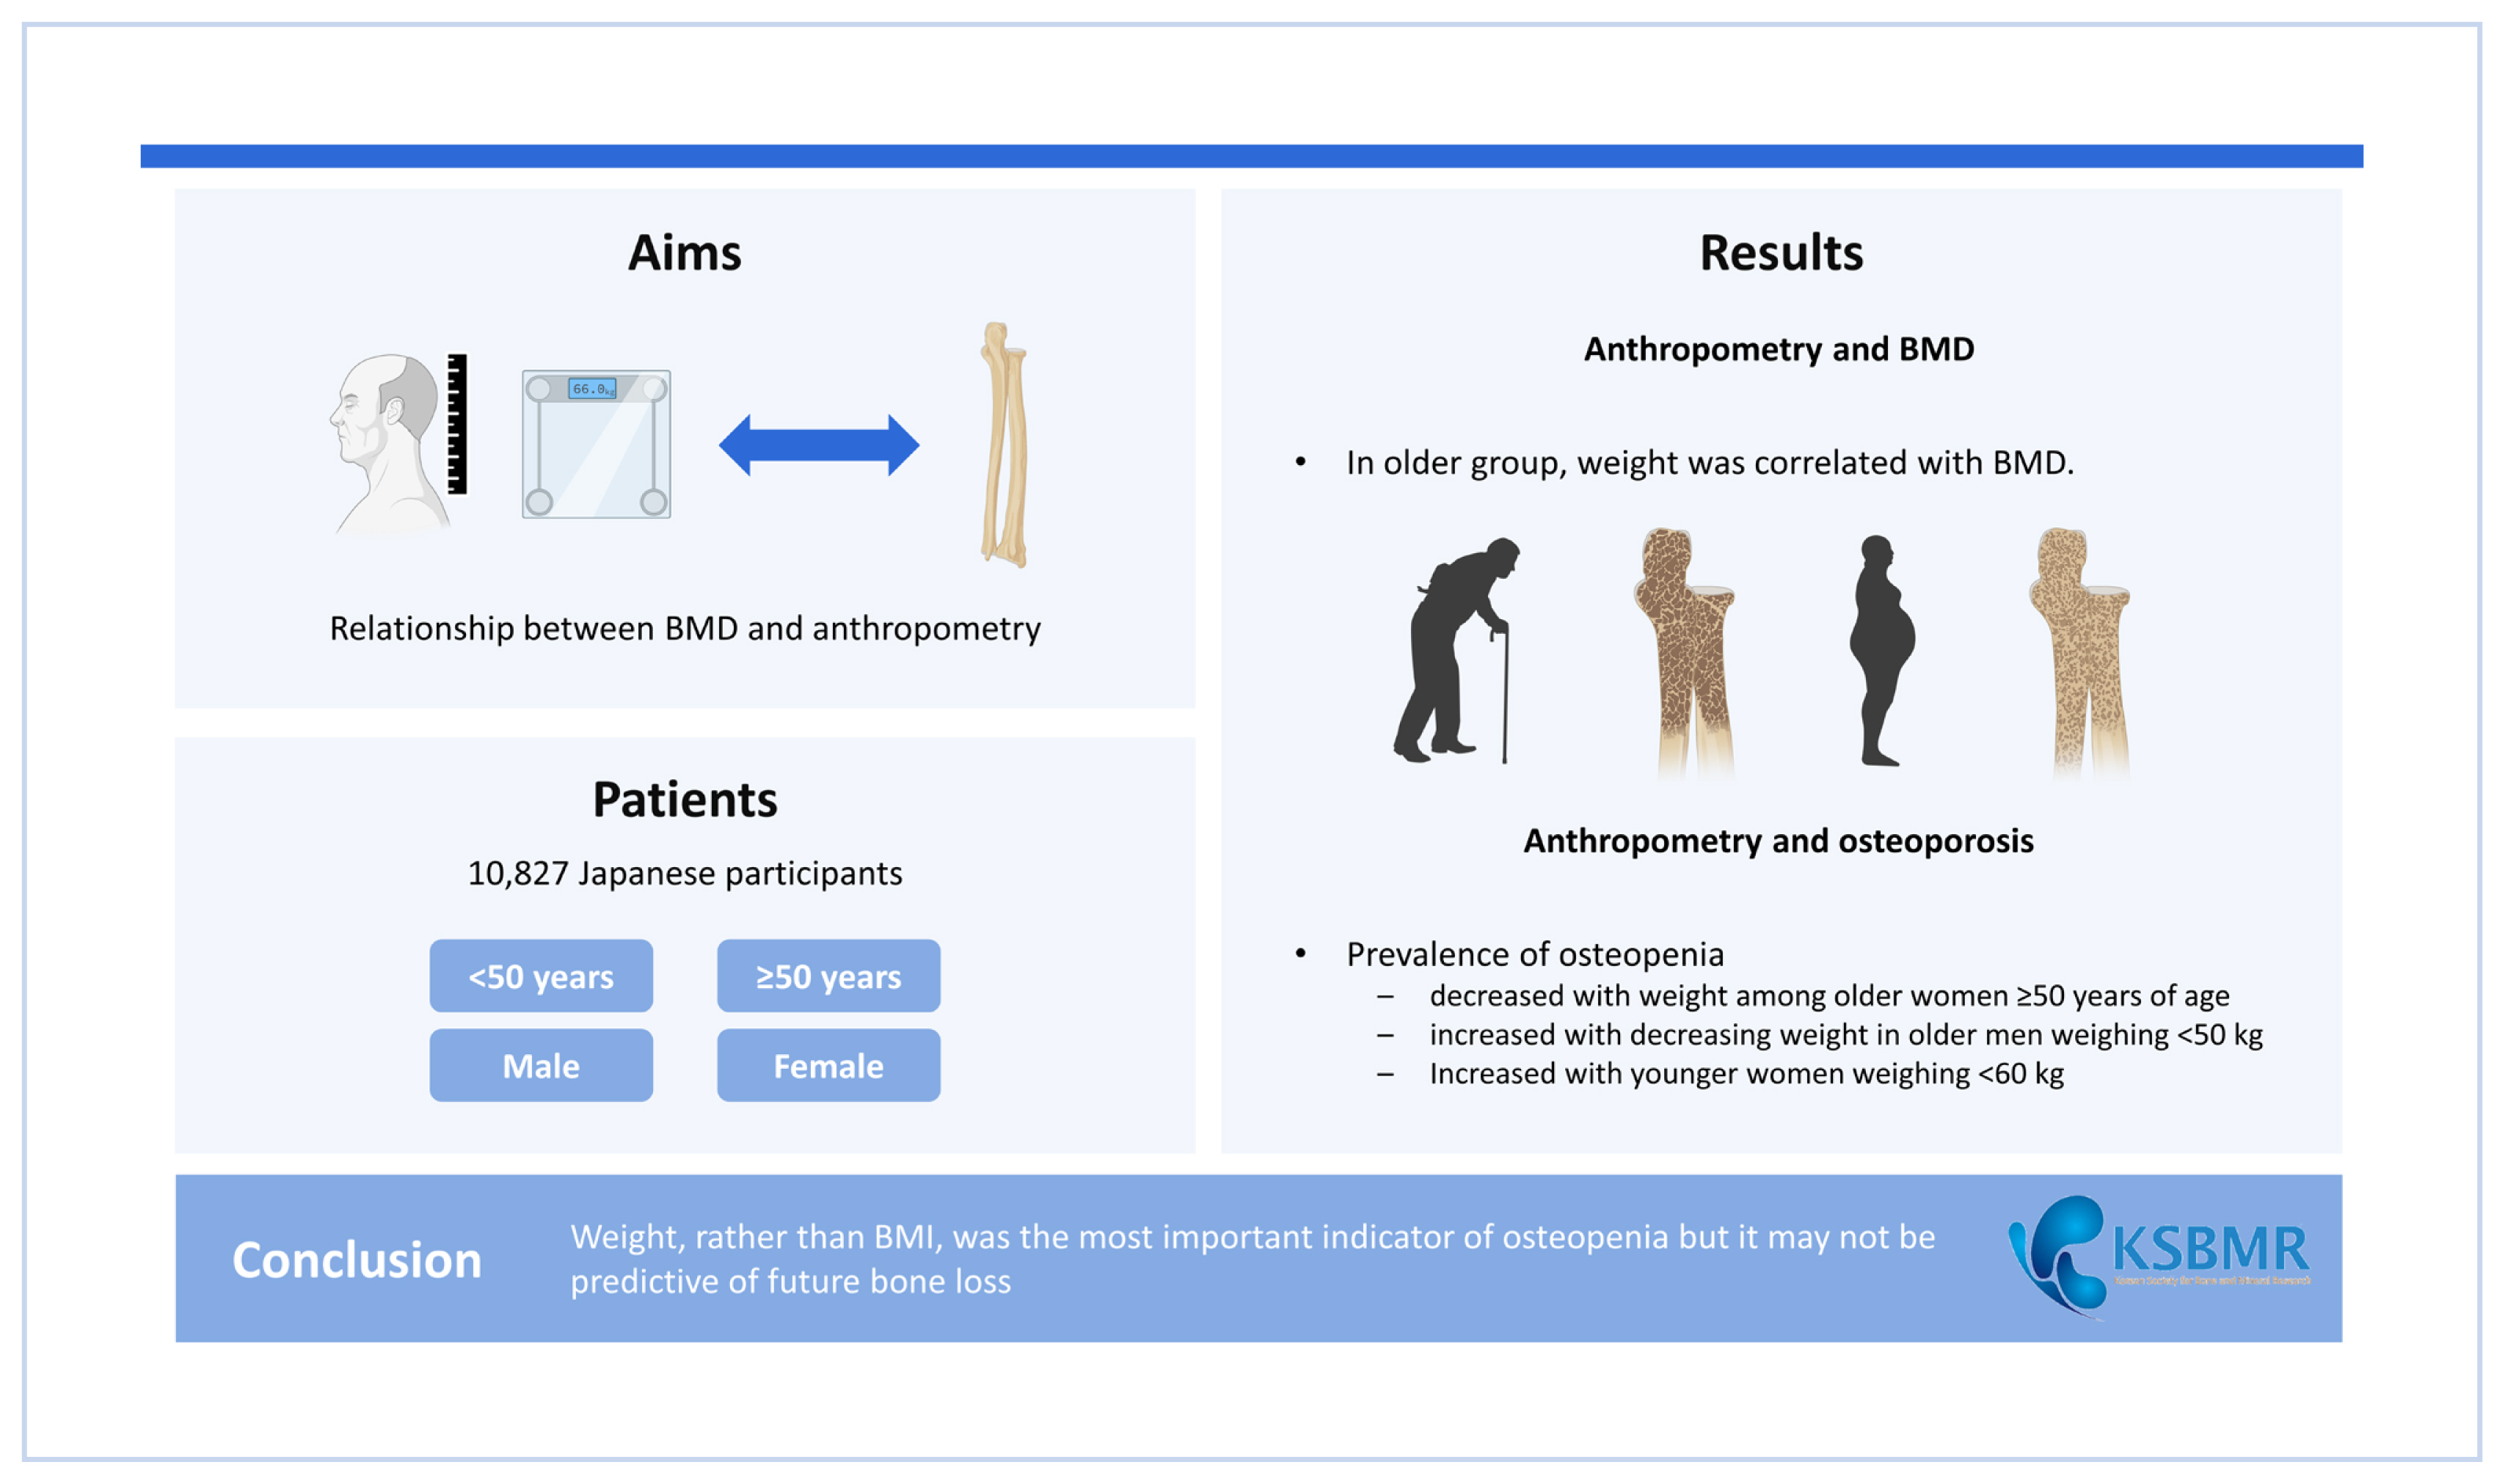
Our cohort included 10,827 participants who underwent multiple medical checkups including distal forearm BMD scans. Participants were stratified into four groups according to age (≥50 years or <50 years) and sex. The BMD values were adjusted for confounding factors, after which single and partial correlation analyses were performed. The prevalence of osteopenia was plotted for each weight index (weight or body mass index [BMI]) class.
Results
Cross-sectional studies revealed that weight was more favorably correlated than BMI in the older group (R=0.278 and 0.212 in men and R=0.304 and 0.220 in women, respectively), whereas weight and BMI were weakly correlated in the younger age groups. The prevalence of osteopenia exhibited a negative linear relationship with weight among older women ≥50 years of age, and an accelerated increase was observed with decreasing weight in older men weighing <50 kg and younger women weighing <60 kg. When weight was replaced with BMI, the prevalence was low in most subgroups classified by weight.
Conclusions
Weight, rather than BMI, was the most important indicator of osteopenia but it might not be predictive of future bone loss.
INTRODUCTION
Bone mineral density (BMD) remains the most important index for diagnosing, managing, and studying osteoporosis/osteopenia [1–3] despite the emerging concept of “bone quality”. For example, the World Health Organization continues to diagnose osteoporosis according to BMD. The associations between anthropometric measurements and BMD have been extensively investigated both cross-sectionally and longitudinally although nutritional status has also been recognized as clinically relevant. However, which anthropometric index associated with BMD according to sex and age has not been identified.
Analyses revealed that low body weight and body mass index (BMI) were associated with lower BMD in older men.[4,5] Cross-sectional investigations [6–9] suggested positive correlations between height and BMD, with greater height associated with higher BMD. However, unlike cross-sectional findings, a longitudinal study showed that low body weight and/or low BMI were not significant predictors of future reductions in BMD.[10] Likewise, baseline height was not shown to affect subsequent BMD changes [10,11] although in these studies weight was not adjusted by height or other known confounding factors such as uric acid,[12] serum lipids,[13] or anemia.[14] To examine discrepancies between baseline anthropometric measurements and changes in BMD, as well as integrating data from sporadic reports of correlations among confounding factors, simultaneous analyses of cross-sectional and longitudinal data collected by a centralized source are needed.
By utilizing one of the world’s largest cohorts with data on BMD measurements, we examined the associations of BMD with baseline height and weight and their interactions and changes both cross-sectionally and longitudinally in Japanese adult men and women widely ranging in age in consideration of possible confounding factors. We intended to identify anthropometric measurements that can be reliably used in association with BMD.
METHODS
1. Study participants
The cohort for the present study was recruited from participants in a health examination program of the Niigata Association of Occupational Health, Inc., which has 18 examination centers throughout Niigata prefecture, Japan. The program included anthropometric measurements, laboratory testing, several physiological tests, BMD measurements, and questionnaires on lifestyle and personal history. This organization was certified by ISO 9001 and ISO 15189 for the health examinations, and laboratory results were quality controlled. We obtained consent from each participant to use a series of their anonymized records of check-ups for scientific research. The study protocol was consistent with the Japanese Government’s Ethical Guidelines Regarding Epidemiological Studies by the Declaration of Helsinki and was reviewed by the Institutional Review Board at the School of Medicine, Faculty of Medicine, Niigata University (reference number 2015–1628).
Between April 1999 and March 2012, 28,583 individuals underwent the annual examinations described above, including 60,025 BMD measurements. For the longitudinal study, we first identified 11,306 people who had more than one annual BMD measurement. Finally, we established a historical cohort of 10,827 individuals, which was used in both cross-sectional and longitudinal studies. Data available for all participants were as follows: examination date, age, anthropometric values (height, weight), blood pressure, heart rate, fasting blood tests (total cholesterol, high-density lipoprotein cholesterol [HDL-C], triglycerides, urea nitrogen, creatinine, uric acid, aspartate transaminase [AST], alanine transaminase [ALT], alkaline phosphatase [ALP], γ-glutamyl transpeptidase, lactate dehydrogenase, total protein, albumin, plasma glucose, HbA1c), and complete blood count, and information on various self-reported lifestyle variables (exercise time, sleep hours, alcohol consumption, and smoking). For each participant, the word “baseline” was defined according to information obtained at the first medical examination. Every participant was stratified by sex and age at baseline into the following four groups: younger men (<50 years of age), elder men (≥50 years of age), younger women (<50 years of age), and elder women (≥50 years of age). We defined “younger” as under 50 years of age because it was shown that BMD begins to decline in Japanese men and women in their fifties. [15]
2. Measurements
Body height and weight were measured with the participant wearing light clothes and no shoes or socks. Values for BMI were computed as weight (kg) divided by height (m) squared. The BMD of the non-dominant distal forearm was scanned by DTX-200 DexaCare (Osteometer MediTech, Signal Hill, CA, USA) using the dual energy X-ray absorptiometry (DXA) method. The measurement area was automatically determined from the point where the distance between ulna and radius was 8 mm to the proximal point of 24 mm.
We performed statistical analyses using the IBM SPSS Statistics (version 24; IBM Corp., Armonk, USA).
3. Statistical analyses
All analyses were performed independently for each of the 4 groups.
As a series of cross-sectional studies, we first conducted Pearson product-moment correlation analyses on baseline height, weight, and BMI with the aim of determining the strength of the correlation between height and weight in each group. To identify confounding factors for bone density among our examined items, including uric acid, serum lipids, etc., as mentioned above, we used the stepwise multiple regression method (Probability of F-to-enter <0.01, Probability of F-to-remove >0.05) regarding the baseline BMD (BMDBL) as the objective variable and each baseline item as an explanatory variable. However, among the items, ALP was excluded from the analyses because it could be elevated due to osteopenia, and AST was omitted because of its strong correlation with ALT.
Then we performed simple and partial correlation analyses of the differences between unadjusted BMDBL (unadj-BMDBL) or BMDBL adjusted for the confounding factors extracted by the above methods as previously shown [12–14] with a linear multiple regression model (adj-BMDBL) and each measured anthropometric value. An alternative measured anthropometric variable was set as a controlling factor for partial correlation. Pearson’s R values >0.2 and P-values less than 0.05 were considered statistically significant.
This study’s unique “young adult mean” and T-scores were calculated for each sex from the BMD values of participants aged 20 to 44, which included 326 men and 1,522 women. Participants were classified as having “osteopenia” if the T-score was <−1. Each of the 4 groups was further stratified into subgroups according to 5 kg increments of body weight or 2.5 kg/m2 increments of BMI. The prevalence of osteopenia was determined for each subgroup.
All participants in the cross-sectional studies were included in the longitudinal study. We aimed to determine how participants’ baseline characteristics affected future BMD changes. Using BMDBL and BMD at the final visit (BMDF), we calculated the annual change rate in BMD (BMDACR) by the formula (BMDF - BMDBL)/[Observational duration] (g/cm2/year) and the annual percent change in BMD (BMDAPC) by 100×BMDACR/BMDBL (%/year). As in the case of cross-sectional studies, we attempted to adjust BMDACR and BMDAPC for various confounding factors and performed correlation analyses for unadjusted or adjusted BMDACR and BMDAPC.
Using BMDBL and BMD at the BMDF, we calculated the annual change rates in BMDACR and BMDAPC for various confounding factors and performed correlation analyses for unadjusted or adjusted BMDACR and BMDAPC.
RESULTS
1. Characteristics of participants
Baseline characteristics of the study participants including anthropometry and laboratory findings and variables regarding BMD are shown in Table 1. Mean values for laboratory test results except total cholesterol in all 4 groups were within reference ranges.
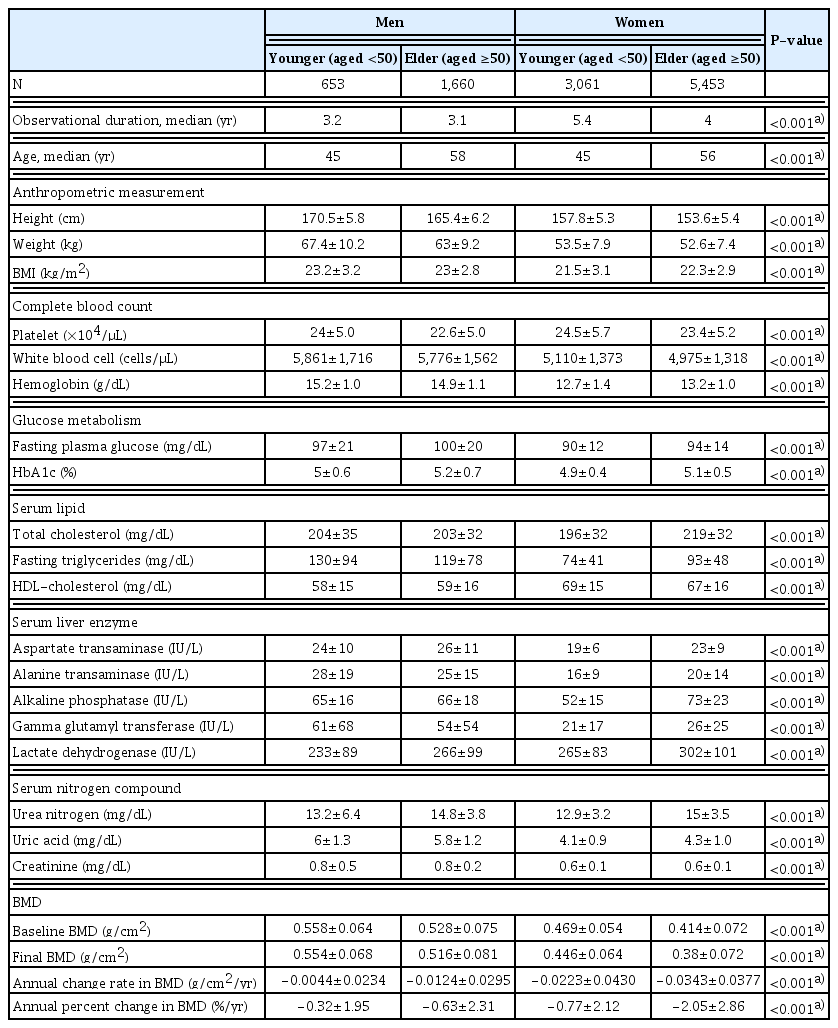
Basic characteristics of participants
Mean baseline BMD reached a plateau at the age of 35 years in men and 25 years in women. After maintaining the plateaued levels for about 20 years, mean BMD started to decline from 50 years of age in both sexes. These transitions were more pronounced than the trajectory of BMD reported in a smaller healthy population in Japan.[16]
Significant correlations were seen between weight and BMI, with correlation coefficients greater among younger than older groups in either sex. In terms of the correlation between height and weight, higher correlations were observed among men and elder groups of both men and women (Supplementary Table 1).
2. Cross-sectional studies
Figure 1 shows the relationship between unadj-BMDBL and anthropometric indices. In the single regression analysis, we found no significant correlations between BMD and height among younger men and women and significant but very weak correlations (R=0.2, P<0.001) among groups of elder men and women. Weak correlations between BMD and weight or BMI (R=0.2–0.4, P<0.001) were shown in all 4 groups.

Correlation between body mineral density and anthropometric measurements. Each panel represents a scatterplot with a linear regression line and coefficient of determination R2.
We selected uric acid and HDL-C as explanatory variables for the dependent variable BMDBL in all 4 groups after single regression analyses. We also added hemoglobin as a factor for adjustment of BMDBL in each group which could be a potential confounder based on previous studies [17] and was weakly correlated only in the elder women group.
Table 2 shows the relationships between adj-BMDBL and anthropometric values. Regarding height vs. adj-BMDBL, correlation coefficients in all 4 groups were close to those of height vs. unadj-BMDBL. In terms of weight or BMI, correlation coefficients were lower but remained significant (R>0.2) even after adjustment by BMDBL. Correlation coefficients of BMI vs. BMDBL were close to or as high as those of weight vs. BMDBL in younger men/women, while weight vs. BMDBL was higher than BMI vs. BMDBL in both male and female elders.

Simple and partial correlation analysis for adjusted baseline bone mineral density and anthropometric measurements
In the partial correlation analysis with height as the control variable, we obtained the following results: the correlation coefficient between adj-BMDBL and weight declined in elder groups and was slightly elevated in younger groups compared with the simple correlation. On the other hand, the R-value between adj-BMDBL and BMI increased slightly only in elder women and was almost unchanged in the other groups. In all 4 groups, the R of adj-BMDBL vs. weight and the R of adj-BMDBL vs. BMI were nearly the same.
Figure 2 shows the prevalence rates of osteopenia in each subgroup according to weight/BMI classes by 5 kg or 2.5 kg/m2 increments, respectively. In terms of the association between weight and prevalence, a simple linear relationship was found in elder women. In elder men and younger women, the prevalence was <5% in those whose weight was ≥50 kg, and the prevalence was elevated in those with lower weights. The prevalence of osteopenia in younger men was consistently <10%. The transition of prevalence by 2.5 kg/m2 BMI classes resembled that of the weight classes mentioned above, while the rates were lower overall, especially in the lightest class of elder women.

(A) Men. (B) Women. Correlation between anthropometric measurements and prevalence of osteopenia. On each panel, solid lines with close symbols represent transition by weight, dotted lines with open markers body mass index (BMI). Squares and circles show the younger group and the elder group, respectively.
3. Longitudinal study
In the single regression analysis, both BMDACR and BMDAPC had no significant correlation with height, weight, or BMI in any group. Multiple regression analyses determined that age was the only appropriate covariate for adjustment of BMDACR or BMDAPC. Adjusted BMDACR or adjusted BMDAPC were not significantly correlated with any of the three anthropometric factors. In addition, partial correlation analyses with anthropometric values as control factors showed no new correlations (Supplementary Table 2).
DISCUSSION
This is the first report of an examination of relationships between anthropometric measurements and forearm BMD both cross-sectionally and longitudinally in a large cohort comprised of men and women of various ages in consideration of many covariates including laboratory test results. Results could lead to an anthropometric index to be used in clinical practice to prevent bone loss and fractures in adults of all ages regardless of sex. Furthermore, a population might be identified whose BMD should be monitored regularly.
Cross-sectional studies clarified that height alone correlated little with BMD, with weight correlating better with BMD than BMI especially in elder men and women with or without adjustment by confounding factors. On the other hand, the longitudinal study did not show that anthropometric values were predictors of future BMD in either sex. Initially, this study attempted to address which anthropometric index is better correlated with BMD and which confounding factors would be important in osteoporosis research or clinical practice. In studies examining correlations between bone density and various factors, weight and height are sometimes used simultaneously for the adjustment of BMD. However, results might not necessarily be statistically appropriate considering the potential correlation between height and weight.
This cohort was representative of the Japanese population for various reasons. The mean height and weight of participants were very close to those of the general population in Japan as reported in The National Health and Nutrition Survey in Japan, 2014.[15] Persons with diseases were not excluded, although participants could be considered “healthy” because all laboratory findings other than low-density lipoprotein cholesterol were within reference ranges. The mean BMDBL values in every 5-year strata were almost identical to those in a previous smaller-scale report from Fukuoka Prefecture, a region far from our study site with a different climate especially during daylight hours, which included 1,786 healthy women and 625 healthy men aged 20 to 79 years (Supplementary Fig. 1).[16]
In cross-sectional analyses, we found that baseline height was not strongly correlated with BMD in any sex or age group, and that since weight was better correlated than BMI with BMD, it should be used to adjust for BMD. In groups of younger men and women, height and BMD were not correlated. In a cross-sectional study of a smaller number of young and old Taiwanese men,[18] it was reported that height was not a predictor of lumbar spine and proximal femur BMD, similar to our results. The correlation coefficient with BMD was only slightly higher with BMI than weight, and the advantage of BMI weakened when adjusted by other non-anthropometric covariates. On the other hand, there was a very weak positive correlation (correlation coefficient approx, 0.2) between unadjusted BMD and height in elder men/women, so BMD was better correlated with body weight than BMI. We assumed that height was a confounding factor in these age groups. In a cross-sectional study of Turkish postmenopausal women that investigated relationships between anthropometric indices or age and T-scores for femur or vertebra, the correlation coefficients were higher in the order of weight, BMI, and height.[6] Although we did not control for medications or medical histories unlike their study, results were similar in our cohort. In a previous study, BMI was used instead of weight for multivariate models for osteoporosis and low BMD, with the explanation that BMI can be used regardless of height although validation was lacking.[19] Another group explained that weight was a better predictor of BMD than BMI, but their study only involved elder women.[20] Our results could be generalized in that the concept was applicable regardless of age or sex.
The strength of correlations between height and weight has varied according to groups or cohorts. For instance, a study of elderly Chinese men and women attempted to solve the problem of collinearity between height and weight by performing principal component analyses; the conclusion was that BMI in elderly people was affected more by weight than by height, suggesting that height could be excluded from covariates for adjustment of central BMD values.[8] Our results for the elder groups supported their conclusion. On the other hand, this finding could not be applied to groups of younger men and women because correlations between height and weight were weaker than in the elderly. However, we still consider that BMI is not a more significant factor in BMD than weight.
Our findings indicated that low weight might be a better indicator of osteopenia than low BMI. As shown in Figure 2, associations between the prevalence of osteopenia and weight or BMI categories were largely dependent upon sex and age. In the elder women group, weight or BMI and the prevalence of BMD had an almost linear correlation with an approximate expression of y=−0.0164x+1.362 (R2=0.9407) and y=−0.027x+1.063 (R2=0.9609), respectively. In contrast, among younger women, the regression lines started to rise from around 60 kg and 22 kg/m2 with an approximate expression of y=−0.0164x+0.98 (R2=0.9274) and y=−0.0269x+0.782 (R2=0.7669), respectively. Increased prevalence of osteopenia was not shown in younger men regardless of weight or BMI. However, there was a progressive increase in osteopenia in elderly men whose weight and BMI were approximately 50 kg and ≤19.5 kg/m2, respectively.
Our results showed that body weight could better detect osteopenia in the non-weight-bearing forearm than low BMI, which might reflect undernutrition. There is little evidence in the literature that body weight loading affects distant bones via humoral factors and biochemical mechanism(s) explaining these phenomena could not be clarified from this epidemiological study. However, our comprehensive research across all ages in both sexes should contribute to a better understanding of the pathophysiology of osteopenia/osteoporosis by incorporating factors related to activity and nutrition into consideration. Furthermore, in short individuals the BMI is calculated to be high, likely placing individuals in obese or “normal range” categories. Translating these results into clinical practice could lead to increased detection of bone loss in younger women weighing <60 kg and elder men weighing <50 kg, who had previously been overlooked.
Several variables that are reportedly [12–14] and significantly associated with BMD were elucidated as independent variables in multivariate analyses such as uric acid and HDL-C in all 4 groups and hemoglobin in the elder women group. It is well known that these blood factors are influenced by nutritional intake and exercise. We did not consider evaluating the relationship between these factors and BMD in detail in this study, and additional research is necessary to prove these associations.
In the longitudinal analysis, we examined the association between anthropometric indices at baseline and subsequent changes in BMD. In all 4 categories, neither weight nor BMI, regardless of adjustments by confounders, were associated with subsequent changes in BMD. These results derived from data on a large number of participants varying in age were not fundamentally different from those of preceding studies in which age categories of participants were limited.[10] The results represented that weight and BMI at one point in time were not predictive of subsequent BMD, meaning that overweight might not contribute to bone maintenance. This might suggest that factors other than anthropometrics have a strong influence on BMD change.
The limitations of this research are as follows. First, although lumbar DXA should be the gold standard for osteoporosis diagnosis, we used the forearm for BMD measurements in the present study. However, multiple reports showed that DXA of the forearm, which is not weight-bearing, detected osteoporosis diagnosed by central DXA. [21–23] It should be noted that bone density measured by DXA showed a significant correlation of r=0.619 between the radius and vertebrae in healthy Japanese women.[24] In addition to the advantages of cost, portability, and ease of use, we thought that measuring forearm BMD as a screening method was worthwhile. Second, lifestyle habits, such as diet and activity which may differ between generations and sex, can affect the formation of the physique during the growth period or the progression of bone loss. In particular, Japanese people experienced a period of turmoil before and after World War II. Decade-long periods of observations are needed to determine if the present results were robust. Third, the medical checkups were arbitrarily applied, and there could be self-selection biases. Participants diagnosed with osteoporosis after their ‘baseline’ might have stopped follow-up. Despite these possibilities, this database is one of the largest global registries with BMD values, anthropometric measurements, and results of laboratory examinations.
In conclusion, our cross-sectional analyses showed that among the anthropometric indices, weight but not height or BMI was most closely correlated with non-bearing forearm BMD regardless of sex or age. Therefore, in screening for osteopenia, we might not need to take body composition into consideration but should only consider weight. From the results of our longitudinal analysis, not all anthropometric indices can be used as predictors of future reductions in BMD. The results could be helpful in understanding how anthropometrics affect BMD at loaded and unloaded sites and also lead to an anthropometric index to be used in clinical practice to prevent bone loss and fractures in both men and women of any age including young adults.
Supplementary Information
Acknowledgments
The authors would like to thank Niigata Association of Occupational Health for their cooperation, especially Mr. Minoru Tashiro for examination databases processing.
Notes
Funding
This study was supported by a Grant-in-Aid for Scientific Research from the Japan Society for the Promotion of Science (Grant number 22H03529 to Hirohito Sone). The sponsor made no contribution to the design, data handling, or interpretation of this study.
Ethics approval and consent to participate
The study protocol was consistent with the Japanese Government’s Ethical Guidelines Regarding Epidemiological Studies in accordance with the Declaration of Helsinki and was reviewed by the Institutional Review Board at the School of Medicine, Faculty of Medicine, Niigata University (reference number 2015-1628).
Conflict of interest
No potential conflict of interest relevant to this article was reported.