Effect of Artificial Intelligence or Machine Learning on Prediction of Hip Fracture Risk: Systematic Review
Article information

Abstract
Background
Dual energy X-ray absorptiometry (DXA) is a preferred modality for screening or diagnosis of osteoporosis and can predict the risk of hip fracture. However, the DXA test is difficult to implement easily in some developing countries, and fractures have been observed before patients underwent DXA. The purpose of this systematic review is to search for studies that predict the risk of hip fracture using artificial intelligence (AI) or machine learning, organize the results of each study, and analyze the usefulness of this technology.
Methods
The PubMed, OVID Medline, Cochrane Collaboration Library, Web of Science, EMBASE, and AHRQ databases were searched including “hip fractures” AND “artificial intelligence”.
Results
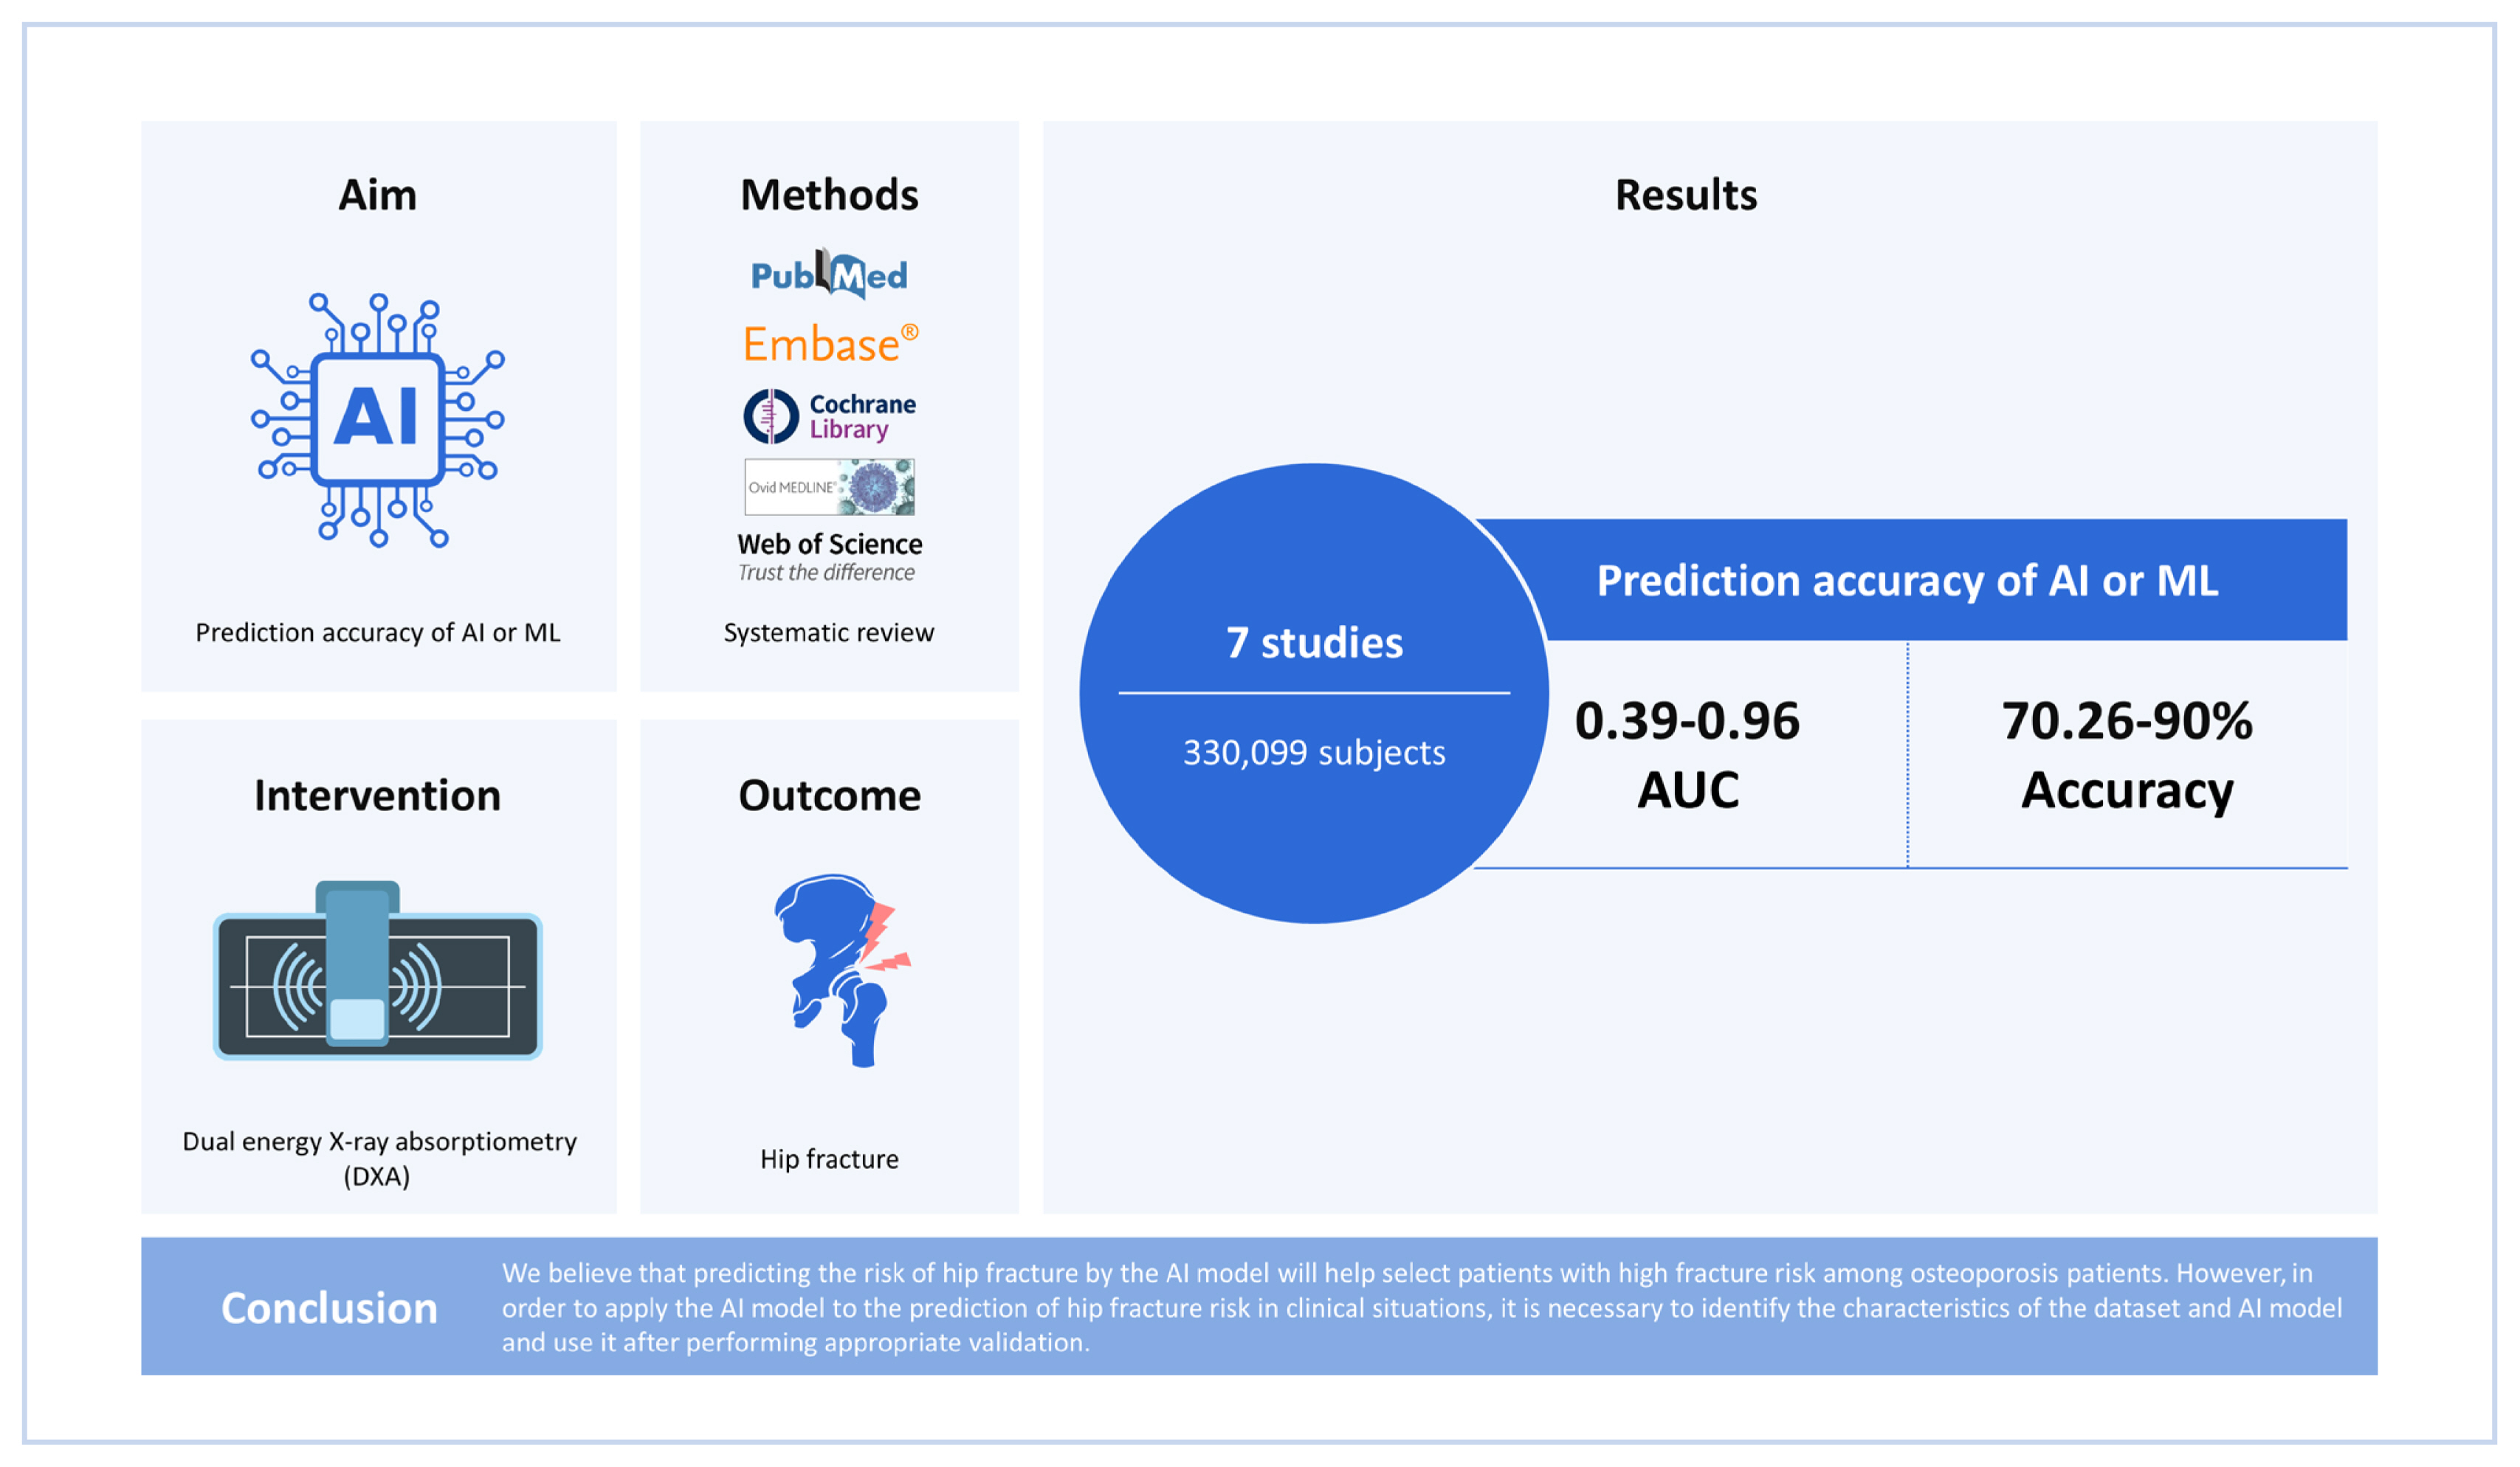
A total of 7 studies are included in this study. The total number of subjects included in the 7 studies was 330,099. There were 3 studies that included only women, and 4 studies included both men and women. One study conducted AI training after 1:1 matching between fractured and non-fractured patients. The area under the curve of AI prediction model for hip fracture risk was 0.39 to 0.96. The accuracy of AI prediction model for hip fracture risk was 70.26% to 90%.
Conclusions
We believe that predicting the risk of hip fracture by the AI model will help select patients with high fracture risk among osteoporosis patients. However, to apply the AI model to the prediction of hip fracture risk in clinical situations, it is necessary to identify the characteristics of the dataset and AI model and use it after performing appropriate validation.
INTRODUCTION
Worldwide, 158 million people over the age of 50 are estimated to have a high risk of osteoporotic fractures.[1] Thus, 1 in 5 men and 1 in 3 women over the age of 50 will experience an osteoporotic fracture.[2] If the high risk of osteoporotic fractures due to an aging population continues, it is predicted that the number of osteoporotic fractures will double by 2045.[1] After osteoporotic fractures, patients suffer reduced quality of life due to chronic pain, functional disability and dependence, high morbidity and mortality.[3] Especially, elderly hip fractures cause a socioeconomic burden in developed countries.[4] Therefore, various programs to properly treat these patients and prevent re-fracture are being implemented in various countries.[5] However, it may be more important to prevent the occurrence of primary fractures by diagnosing and treating osteoporosis, the main cause of these fractures, at an early stage.
Dual energy X-ray absorptiometry (DXA) is one of the preferred modalities for screening or diagnosis of osteoporosis and can predict the risk of hip fracture to some extent.[6,7] However, a study by Hsieh et al. [8] found that 80% of patients between the ages of 40 and 90 who had visited their institution and had pelvis or spine radiographs did not have a DXA test. Also, the DXA test may be difficult to implement easily in some developing countries.[1] Although the fracture risk assessment tool (FRAX) can predict the risk of hip fracture, symptomatic lumbar or occult hip fractures and fractures have been observed before patients underwent DXA.[1] Therefore, if there is no hassle of performing additional tests and a method of predicting the risk of hip fracture only by taking radiographs is provided, it will be possible to reduce the radiation exposure of patients and reduce additional costs.
Artificial intelligence (AI) or machine learning (ML) is a computational modeling tool widely accepted for modeling complex real-world health problems.[9] AI has already been used in many fields of medicine, such as nephrology, microbiology, and radiology, and is being studied in various fields such as diagnosis of fractures and prediction of clinical courses in orthopedics.[10] Although it is possible to predict the risk of hip fracture only with bone mineral density (BMD) or clinical factors, the prediction model using AI can compensate for the shortcomings of existing examination methods and handle large numbers of input variables simultaneously. Also, if an automated system of AI is constructed, there is an advantage that the hassle of checking examinations can be solved.[11] However, it seems that little is known about the assessment of hip fracture risk by AI yet.
Therefore, the purpose of this systematic review is to search for studies that predict the risk of hip fracture using AI or ML, organize the results of each study, and analyze the usefulness of this technology.
METHODS
1. Study eligibility criteria
Studies were selected based on the following inclusion criteria: (1) studies using AI or ML techniques for prediction of hip fracture risk, such as femoral neck fracture, intertrochanteric fracture, or subtrochanteric fracture; and (2) studies reporting on a statistical analysis of area under the curve (AUC) or accuracy for prediction of hip fracture risk. Studies were excluded if they failed to meet the above criteria.
2. Search methods for identification of studies
The PubMed, OVID Medline, Cochrane Collaboration Library, Web of Science, EMBASE, and AHRQ databases were searched to identify relevant studies published up to June 2022 with English language restriction. The following search terms were used ("hip fractures"[MeSH Terms] OR ("hip"[All Fields] AND "fractures"[All Fields]) OR "hip fractures"[All Fields] OR ("hip"[All Fields] AND "fracture"[All Fields]) OR "hip fracture"[All Fields]) AND ("artificial intelligence"[MeSH Terms] OR ("artificial"[All Fields] AND "intelligence"[All Fields]) OR "artificial intelligence"[All Fields]). A manual search was also conducted for possibly related references. Two authors, Yonghan Cha and Jung-Taek Kim, reviewed the titles, abstracts, and full texts of all potentially relevant studies independently, as recommended by the Cochrane Collaboration. Any disagreement was resolved by the third reviewer, Jun-Il Yoo. We assessed full-text articles of the remaining studies according to the previously defined inclusion and exclusion criteria, and then selected eligible articles. The reviewers were not blinded to authors, institutions, or the publication.
3. Data extraction
The following information was extracted from the included articles: authors, publication year, study period, number of patients, sex, age, AI algorithm variables for AI training, AUC, or accuracy for prediction of hip fracture risk.
RESULTS
The initial search identified 123 references from the selected databases. Eighty-two references were excluded by screening the abstracts and titles for duplicates, unrelated articles, case reports, and systematic reviews. The remaining 45 studies underwent full-text reviews and subsequently, 38 studies were excluded. Finally, 7 studies are included in this study.[8,12–17] The details of the identification of relevant studies are shown in the flow chart of the study selection process (Fig. 1).
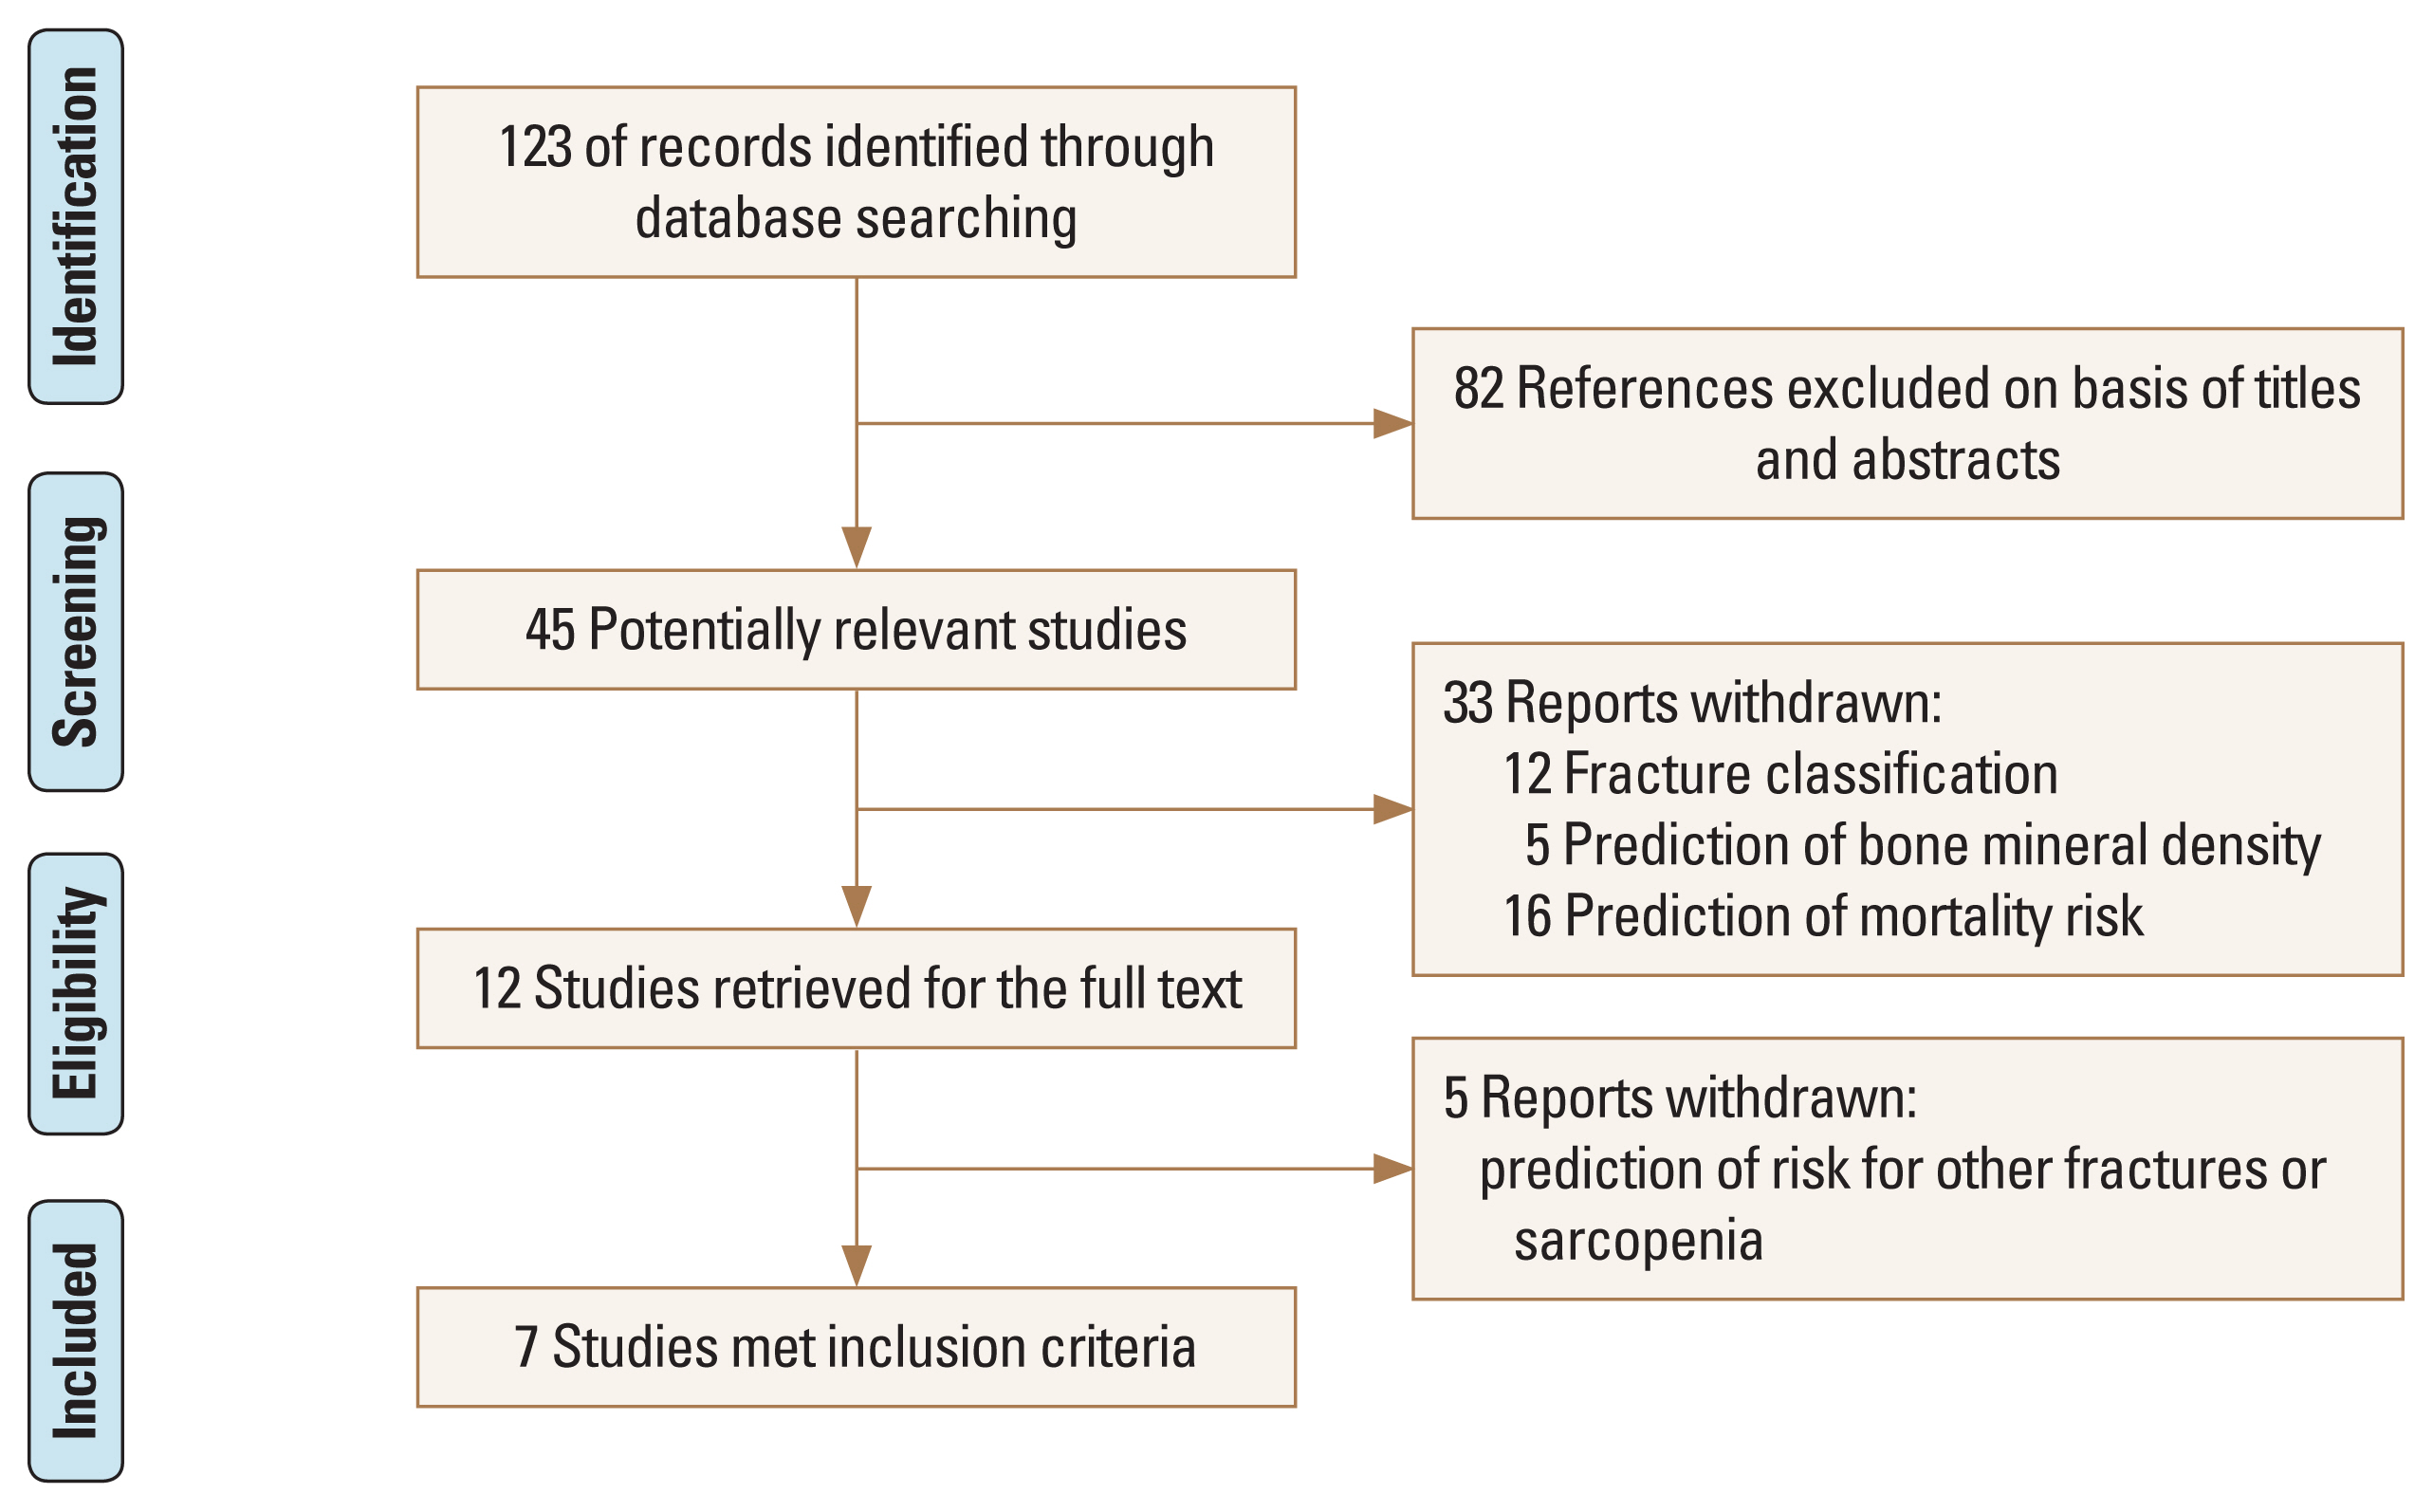
The flow chart of the study selection process.
The total number of subjects included in the 7 studies was 330,099 (Table 1). There were 3 studies that included only women,[12–14] and 4 studies included both men and women.[8,15–17] One study conducted AI training after 1:1 matching between fractured and non-fractured patients.[17]
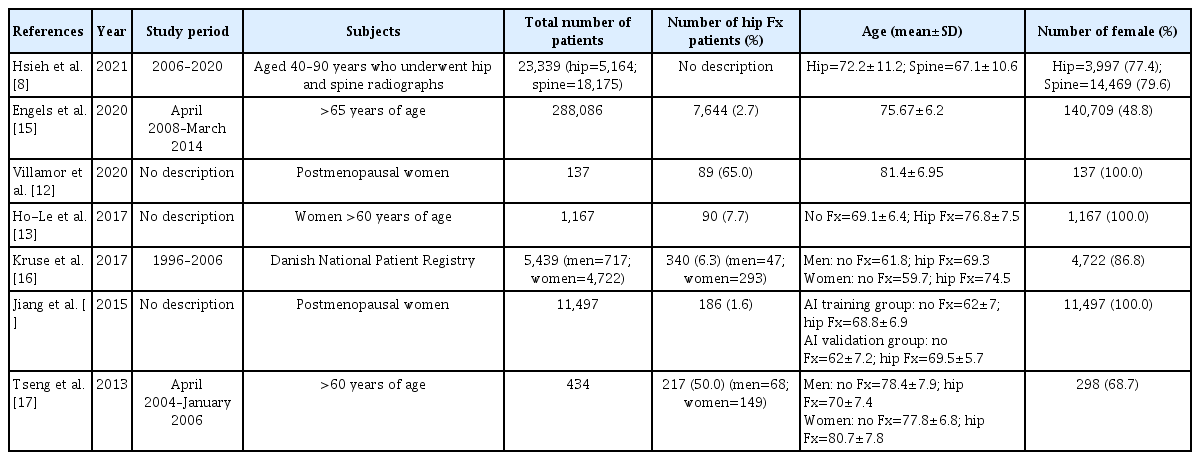
Study, study period, demographic data of included studies
The AI algorithm used for prediction of hip fracture risk was very diverse, such as Artificial Neural Network, support vector machine, and K-nearest neighbors, etc. (Table 2). In addition, the variables used for AI training included not only demographic factors such as age, sex, body mass index, and past medical history, but also socioeconomic factors such as income level and education level. Also, Villamor et al. [12] used geometrical factors of femur from finite element analysis with patient’s demographic factors for AI training. Hsieh et al. [8] used pelvis and lumbar spine radiographs and DXA as variables for hip fracture risk prediction. The AUC of AI prediction model for hip fracture risk was 0.39 to 0.96. The accuracy of AI prediction model for hip fracture risk was 70.26% to 90%.
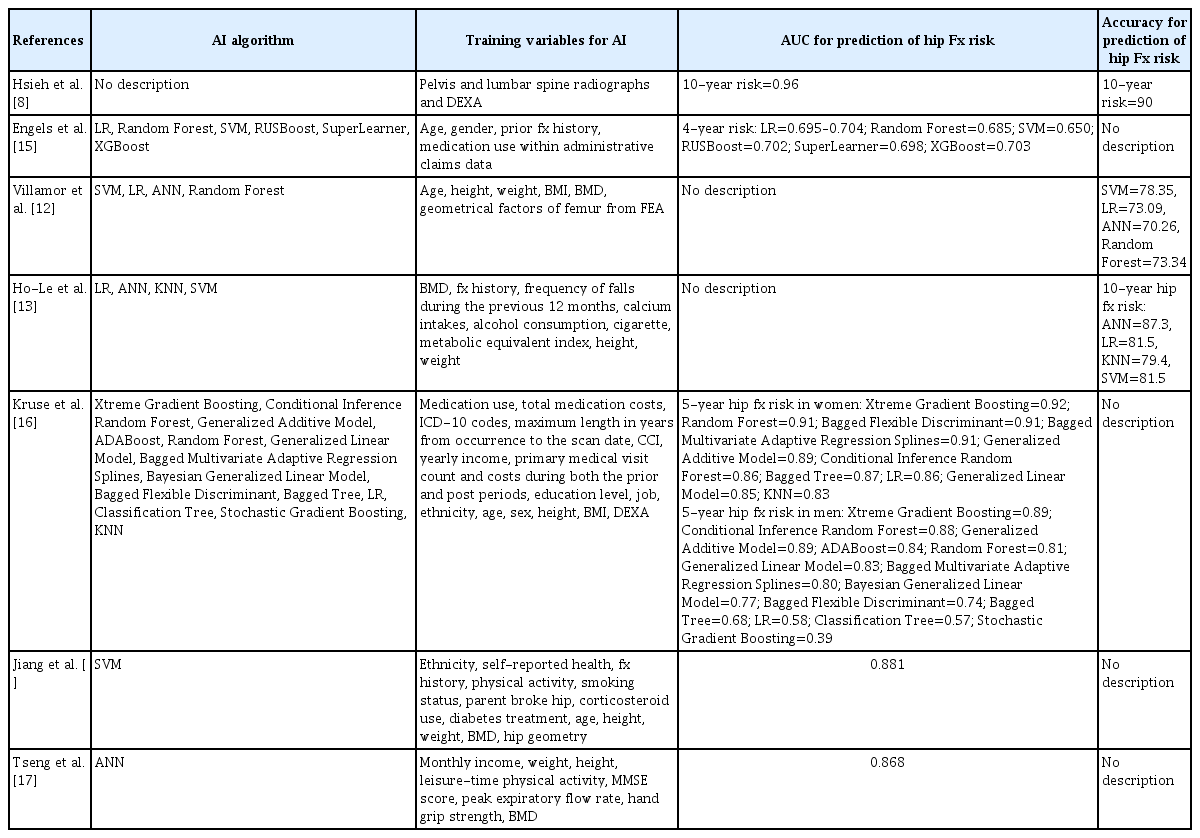
Prediction model of artificial intelligence and results of prediction for hip fracture risk in included studies
DISCUSSION
The identification of high-risk individuals for hip fracture is clinically and socioeconomically important, because it could facilitate early intervention to reduce the burden of hip fracture in the general population.[13] However, osteoporosis is a silent disease that progresses before osteoporotic fractures.[18] After fracture has occurred, it increases mortality and morbidity in affected patients. Therefore, population-based screening is essential to identifying at-risk patients and implementing preventive services. But, prediction of hip fracture is very difficult, because it is influenced by multiple risk factors. Known risk factors for hip fracture are low BMD, previous history of hip fracture, female, advanced age, lower body weight and physical activity, sarcopenia, alcohol consumption, and smoking, etc.[19] Although the most clinically important risk factor is low BMD, considering BMD and other clinical factors together for predicting fracture risk can increase accuracy.[13] However, as in FRAX, the assessment of hip fracture risk using conventional methods may not include several important factors.[11] On the other hand, hip fracture prediction using ML can handle large numbers of input variables simultaneously and consider invisible relationships between variables.[11] Also, as Kruse et al. [16] showed in their study, there is an advantage of not having to go through input work by clinicians if the system is built to automatically analyze clinical data or image data in the AI model.
BMD and FRAX are commonly used as key tools for assessing hip fracture risk in clinical practice. However, several studies have reported using statistical regression analysis to predict hip fracture occurrence based on demographic factors of patients. Aldieri et al. [20] reported on the prediction of hip fracture using logistic regression analysis with demographic data (such as age, weight, and height), BMD, and quantitative computed tomography (QCT) data in a cohort of 100 Caucasian postmenopausal women aged 55 or older. Their study showed AUC values ranging from 0.64 to 0.92 depending on the combination of QCT data shape and intensity.[20] Baker-LePain et al. [21] conducted prediction analysis for hip fracture using a statistical technique called Active Shape Modeling in a cohort of 168 individuals aged 65 or older who had experienced hip fractures and 231 individuals who had not. The reported AUC values ranged from 0.631 to 0.835 in their studies.[21] Through these 2 studies, it was demonstrated that traditional statistical analysis using a well-combined set of variables can achieve accuracy similar to AI-based prediction. However, a limitation of such statistical analyses is that the selection of variables ultimately relies on human decision-making, making it challenging to establish a fully automatic system. In the studies included in our review, the reported AUC values ranged from 0.39 to 0.96, suggesting that AI models have the potential to achieve very high AUC values compared to previous studies utilizing traditional statistical analyses. However, direct comparisons between traditional statistical analysis and AI prediction in terms of accuracy for hip fracture prediction have not been made yet, indicating the need for further research.
Considering the results of the studies included in this review, AUC and accuracy for prediction of hip fracture risk by AI ranged from low to high. This seems to be because the variables and AI algorithms used are very diverse. These reports also make it difficult for clinicians to determine which model is the best. Therefore, when evaluating the results of studies on the prediction of hip fracture risk using the AI model, the following should be considered. The first is to check whether external validation is present. Kruse et al. [16] argued that it could be very dangerous to report the results after training using one AI model or dataset. They also said that some studies have reported the results of prediction models without external validation, and these problems are not well known. The second factor to pay attention to in hip fracture prediction analysis using AI model is overfitting. Ho-Le et al. [13] reported that overfitting could be a problem in any AI models, and that the number of hip fractures per risk factor was >10 to prevent overfitting. They argued that the consistency between training and test results of AI algorithm models is important to determine whether over-fitting is occurring. A third consideration is the problem of handling missing data in the dataset used for AI training. A lot of data is required for AI training, and especially big database facilitates this. However, not all patients in the database have all the data. Therefore, it is advisable to check whether techniques for missing data such as imputation are used. However, Jiang et al. [14] reported that these techniques were not necessary because the purpose of their study was primarily to demonstrate the potential increase in predictive ability by combining clinical and computational data.
There are several limitations to our study. First, we did not consider the degree of training of AI algorism. Second, because the occurrence of hip fractures in the elderly is multifactorial and influenced by various latent factors, we did not take into account the number and types of variables used in the prediction model when interpreting the study results. As a result of these influences, the AUC and accuracy values of the AI model are found to be diverse. Third, we have not been able to conclude which AI model is the most accurate for prediction of hip fracture yet. Fourth, the observed hip fracture rates in the 7 studies included in our systematic review exhibit significant variation. This suggests a high heterogeneity among the patients included in each study, which could potentially impact the accuracy of AI predictions for hip fractures.
We believe that predicting the risk of hip fracture by the AI model will help select patients with high fracture risk among osteoporosis patients. However, to apply the AI model to the prediction of hip fracture risk in clinical situations, it is necessary to identify the characteristics of the dataset and AI model and use it after performing appropriate validation.
Notes
Ethics approval and consent to participate
Not applicable.
Conflict of interest
No potential conflict of interest relevant to this article was reported.
Funding
This research was supported by a grant of the Korea Health Technology R&D Project through the Korea Health Industry Development Institute (KHIDI), funded by the Ministry of Health & Welfare, Republic of Korea (grant number: HI22C 0494). This work was supported by biomedical research instiute fund (GNUHBRIF-2019-0013) from the Gyeongsang National University Hospital.