


INTRODUCTION
In osteoporosis, bone strength decreases due to the deterioration of bone quality and loss of bone mass associated with aging. The current diagnosis of osteoporosis is mainly based on areal bone mineral density (aBMD), measured using dual energy X-ray absorptiometry (DXA).[1] A lower T-score increases the likelihood of osteoporotic fractures. Although the T-score is a key criterion for diagnosing osteoporosis, it cannot reliably predict osteoporotic fractures.[2,3] In fact, most osteoporotic fragility fractures occur during osteopenia and not osteoporosis.[4] This is partly due to the higher proportion of patients with osteopenia; however, the DXA diagnoses osteoporosis based only on bone mass and does not reflect bone quality.
In recent times, further analysis for quality of bone, such as trabecular bone score (TBS) and central quantitative computed tomography (cQCT) have been used in clinical settings to compensate for the limitations of DXA and determine bone status more realistically.[5,6] TBS is obtained through texture analysis of DXA and reflects the strength of the trabecular microarchitecture.[7] Also, TBS shows a similar tendency as aBMD for tracing the effect of anti-osteoporotic medications.[8] cQCT can rule out conditions such as spinal stenosis and aortic calcification, which might be overestimated through aBMD in DXA. cQCT measures volumetric BMD (vBMD) at central sites, such as the lumbar spine (LS) and hip.[9,10] It has been reported that TBS and cQCT can predict osteoporotic fractures.[11,12]
Osteoporosis frequently occurs in the elderly and is commonly associated with falls and fractures, leading to high morbidity and mortality.[13,14] The more osteoporotic fragility fractures occur, the greater morbidity and dependence of those who do not. Therefore, accurate prediction of osteoporotic fractures is important in the clinical setting. We aimed to investigate the association between baseline compression fracture (CF) and aBMD, TBS, and cQCT results and then evaluated the ability of densitometric results to predict new-onset vertebral fragility fractures (VFFs) in postmenopausal women.
METHODS
1. Participants
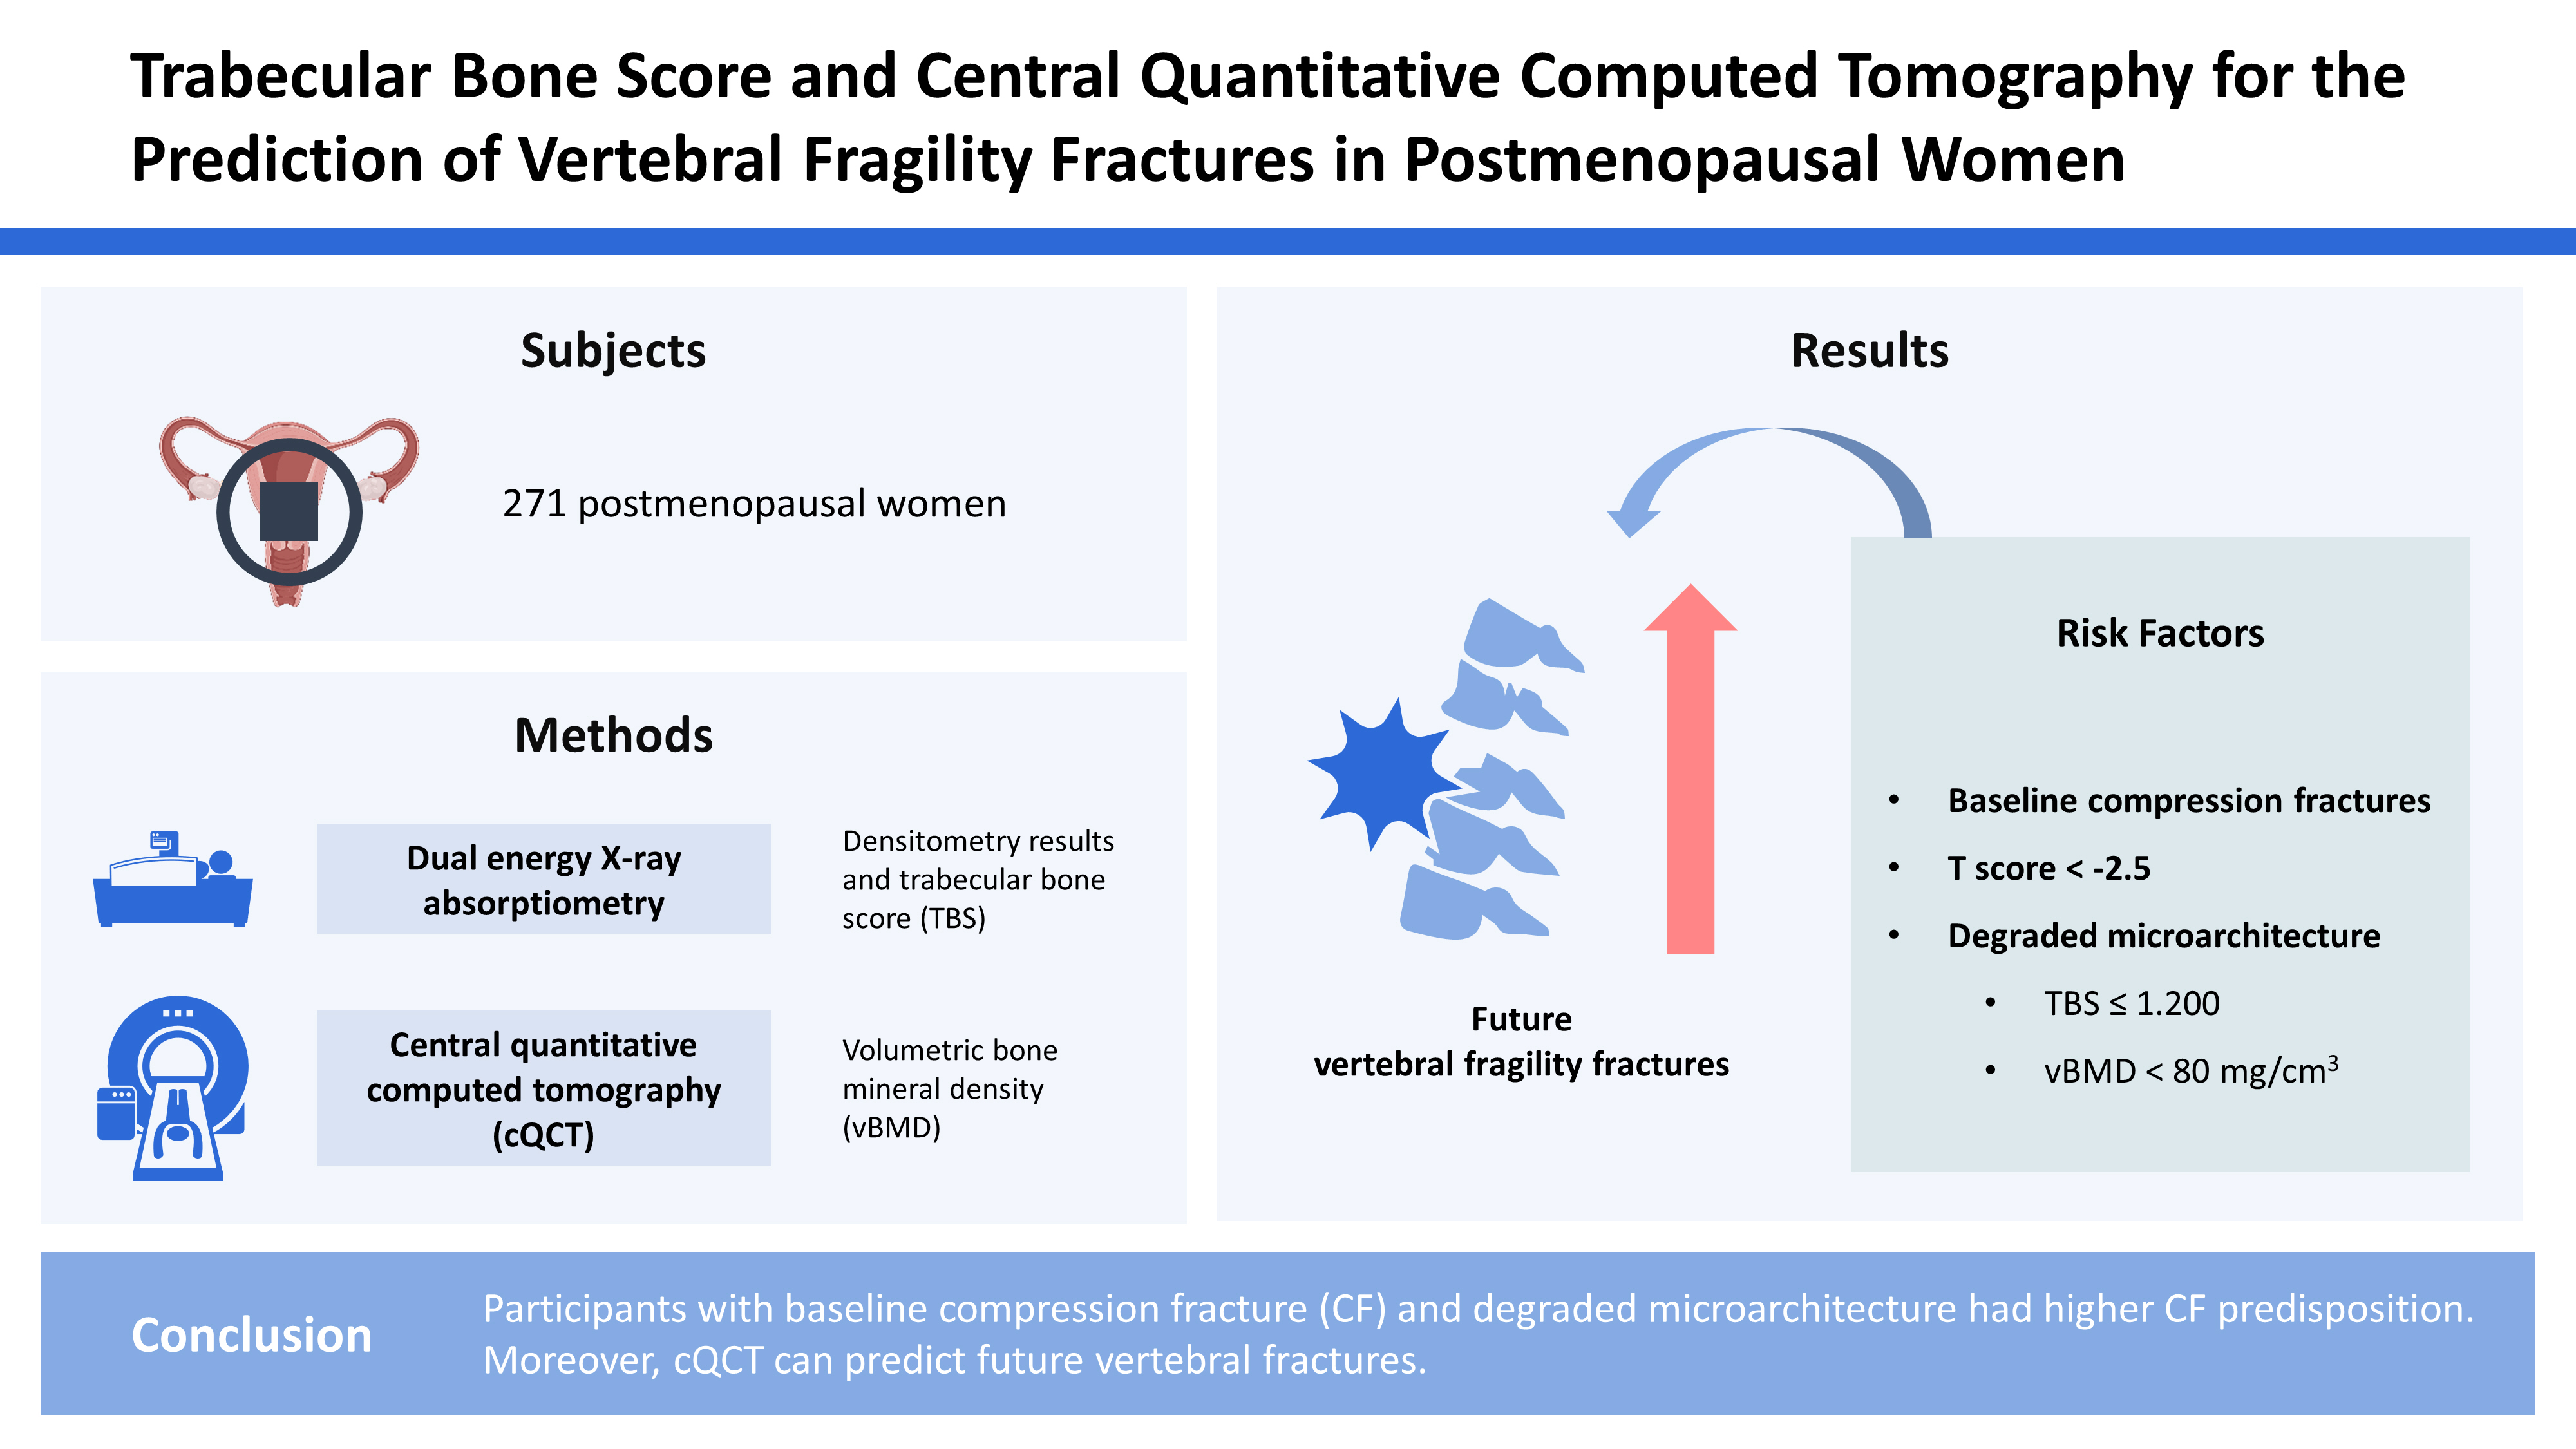
This study was a retrospective and cross-sectional analysis of data extracted from the osteoporosis dataset of the Pusan National University Hospital. We recruited 744 postmenopausal women who visited the endocrinology outpatient clinic for the screening or management of bone health and were evaluated with both DXA and cQCT for BMD assessment between September 2016 and September 2017. All participants were also evaluated with both baseline radiography and follow-up radiography of the thoracolumbar spine (TLS) for the examination of a new-onset fragility fracture of the spine. Patients who were diagnosed with or had a history of the following diseases were excluded: abnormal thyroid-stimulating hormone level (N=240), history of malignancy (N=118), and other underlying diseases which could affect the bone status, including diabetes mellitus (N=89), rheumatic arthritis (N=12), and hepatitis (N=14). In total, 271 postmenopausal women were enrolled. This retrospective study was approved by our institutional review board, which waived the requirement for written informed consent (IRB no. 1809-018-071).
2. DXA
The aBMD of the LS and femoral neck (FN) was determined using DXA scan images (Lunar Prodigy; GE Medical Systems, Madison, WI, USA). We used only L1-3 vertebrae in the present study because of the limited provision of vBMD from cQCT. Daily calibration and quality assurance testing were performed, and the coefficient of variation for precision in measuring the aBMD of the LS was 0.34%. The aBMD was expressed as g/cm2, and the T-score was defined as the standard deviation (SD) from the mean aBMD for a reference group from the general population matched for sex at 25 to 35 years of age and was analyzed using Encore software (version 13.0; GE Medical Systems). The diagnosis was based on the World Health Organization classification using T-scores, as follows: T-score ≤−2.5 SD was defined as osteoporosis, T-score between −2.5 and −1.0 SD was defined as osteopenia, and T-score ≥−1.0 SD was considered as normal. The diagnosis was decided in LS and FN, separately. The additional diagnosis was also made according to the lowest value of T-score from LS or FN for the subgroup analysis. The TBS of the LS was generated from the LS DXA file using the TBS iNsight software (version 3.0.2.0; Medimaps Group, Geneva, Switzerland). We used the following TBS cutoffs proposed by an international working group of TBS users for postmenopausal women: normal status as TBS values ≥1.35, partially degraded microarchitectural status as values between 1.20 and 1.35, and degraded microarchitectural status as values ≤1.20.[15]
3. cQCT
A Philips Brilliance 16-slice multidetector helical CT scanner (GEMINI TF CT, Philips, Eindhoven, The Netherlands) was used to acquire the vBMD at the LS (L1-3). CT was performed at a voltage of 120 kVp, with a slice thickness of 3 mm. The CT images were processed to obtain the vBMD using QCT Pro (version 4.2.3.; Mindways Software, Inc., Austin, TX, USA), in conjunction with a solid-state CT calibration phantom (Model 3 QA phantom; Mindways Software, Inc.), which was scanned simultaneously with the patient.
Normal BMD, osteopenia, and osteoporosis were defined based on the vBMD obtained using cQCT. A spinal vBMD below 80 mg/cm3 indicated osteoporosis, and a vBMD in the 80 to 120 mg/cm3 indicated osteopenia. A vBMD higher than 120 mg/cm3 was considered normal. A daily quality assurance test using the QCT Pro was performed, and the coefficient of variation for precision in measuring the vBMD for the LS was 0.34%.
4. Follow-up protocol
All participants regularly visited the hospital for follow-up according to the protocol developed based on results from the physical examination, history, and X-ray of the TLS. The primary endpoint for analysis was fragility fracture-free survival (FFS), which was defined as the interval between the initial date of baseline imaging and the date of detection of a structural CF. Fragility CFs were defined according to the Genant criteria.[16]
5. Statistical analysis
Values of all normally distributed variables are expressed as mean±SDs and values of variables with non-normal distribution as medians and interquartile ranges (IQR; 25%-75%). For comparing the categorical data of the groups, Mann-Whitney U test was used. Associations between variables were analyzed using linear regression analyses by calculating the Pearson’s correlation coefficient (r). The data were analyzed using the Kruskal-Wallis test to verify differences in the diagnoses of normal BMD, osteopenia, and osteoporosis determined by DXA or cQCT between the groups. FFS curves were plotted using the Kaplan-Meier method, and the log-rank test was used to determine their significance. A Cox proportional hazards model was used to identify the predictive values for the diagnosis of osteoporosis using DXA and cQCT, TBS status, and previous history of CFs. Statistical analyses were performed using the MedCalc software (version 16.4.3; MedCalc, Mariakerke, Belgium) and RStudio (version 1.2b; Rstudio, Boston, MA, USA). A P-value of less than 0.05 was considered indicative of significance.
RESULTS
1. Baseline characteristics
The median age of the participants was 62.0 (IQR, 56.0-70.0) years. In all, 124 participants (45.8%) had normal BMD based on the T-score of the LS, and 105 participants (38.7%) had normal BMD based on the T-score of FN. Among all participants, 68 (25.1%) had normal TBS status. cQCT imaging showed that about half of the participants (N=133, 49.1%) had vBMD indicative of osteoporosis (Table 1).
2. Difference in densitometric findings and future fragility fractures according to the presence of baseline CF
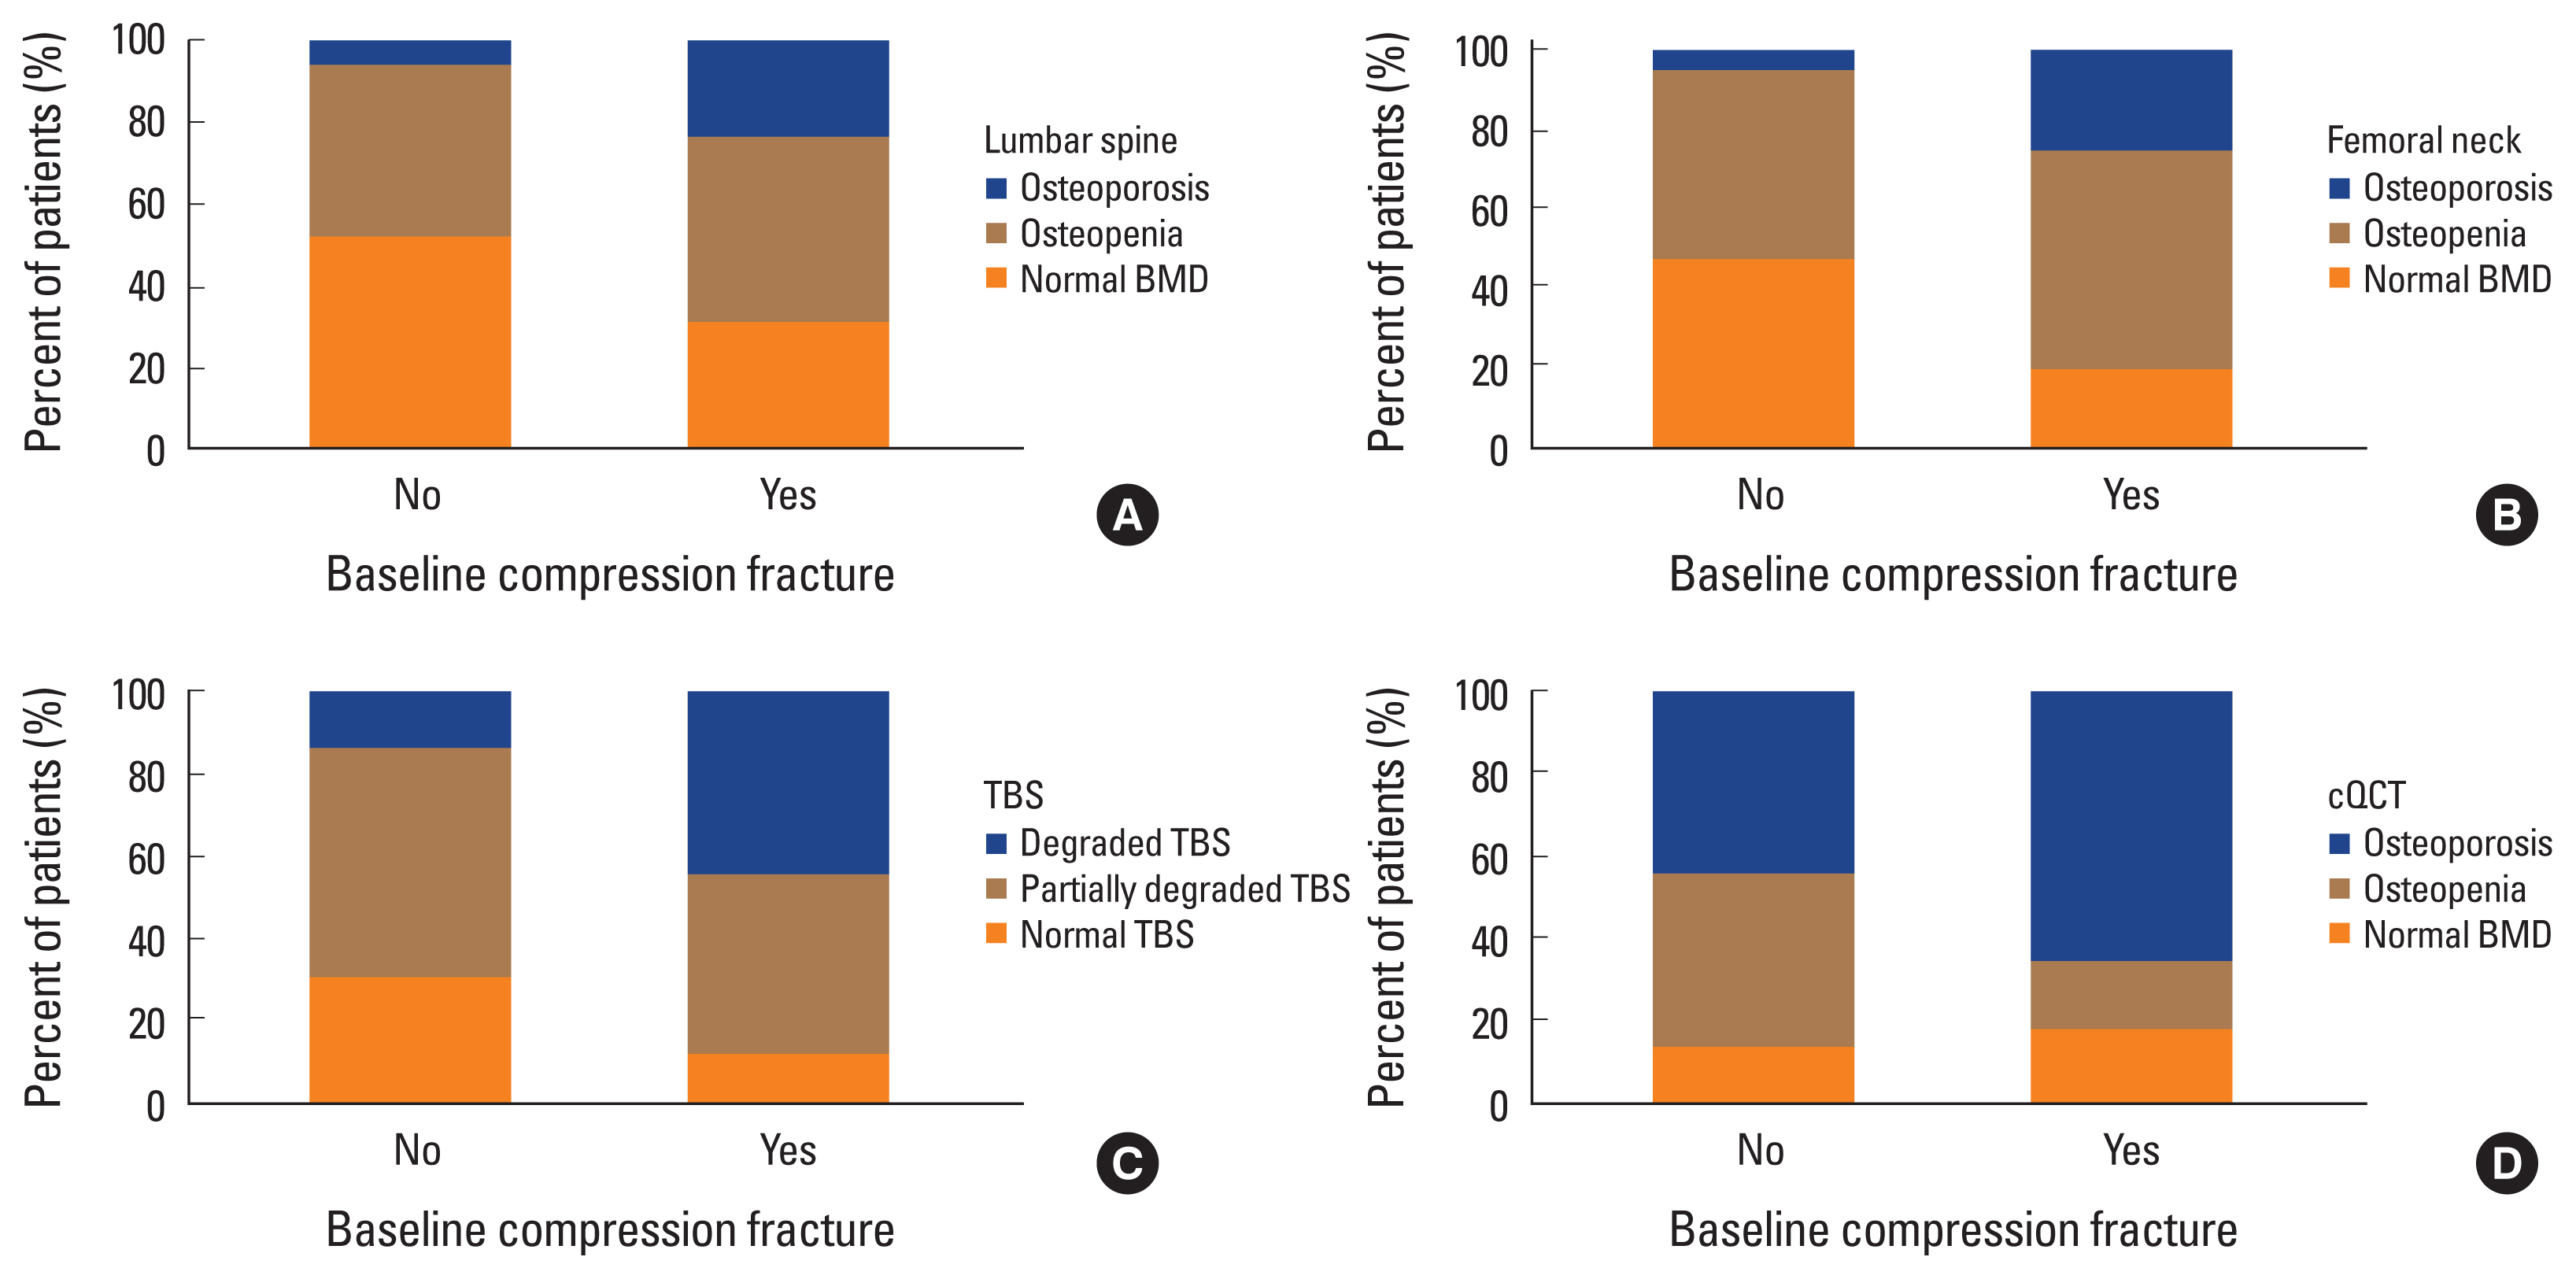
The median age and body mass index did not differ between participants with and without baseline CFs. The difference in bone status based on aBMD, TBS, or vBMD was statistically significant among 2 groups. Patients with abnormal TBS and vBMD findings were associated with a higher proportion of baseline CFs (P<0.001). The median TBS (median, 1.326 vs. 1.246; P<0.001) and median vBMD (median, 83.650 vs. 60.200; P<0.001) were significantly higher in participants without baseline CFs than in those with baseline CFs. A significantly higher proportion of participants showed a normal status of LS and FN on DXA compared to the proportion of participants with a normal diagnosis of cQCT (Table 2). The participants with baseline CFs were diagnosed based on aBMD for LS (N=18, 23.7%) and FN (N=20, 26.3%) (Fig. 1A, B). The participants with baseline CFs were also diagnosed with degraded microarchitecture based on TBS (N=34, 44.7%) and showed their vBMD was indicative of osteoporosis (N=49, 64.5%) (Fig. 1C, D).
During follow-up period, 26 patients in total had newly occurred fragility fractures. Specifically, 15 (57.7%) patients who initially had baseline CF were diagnosed to have new-onset fragility fractures, and 11 (42.3%) patients who didn’t have baseline CF developed newly diagnosed fragility fractures (Table 2).
3. Predictive factors including densitometric markers of fragility FFS
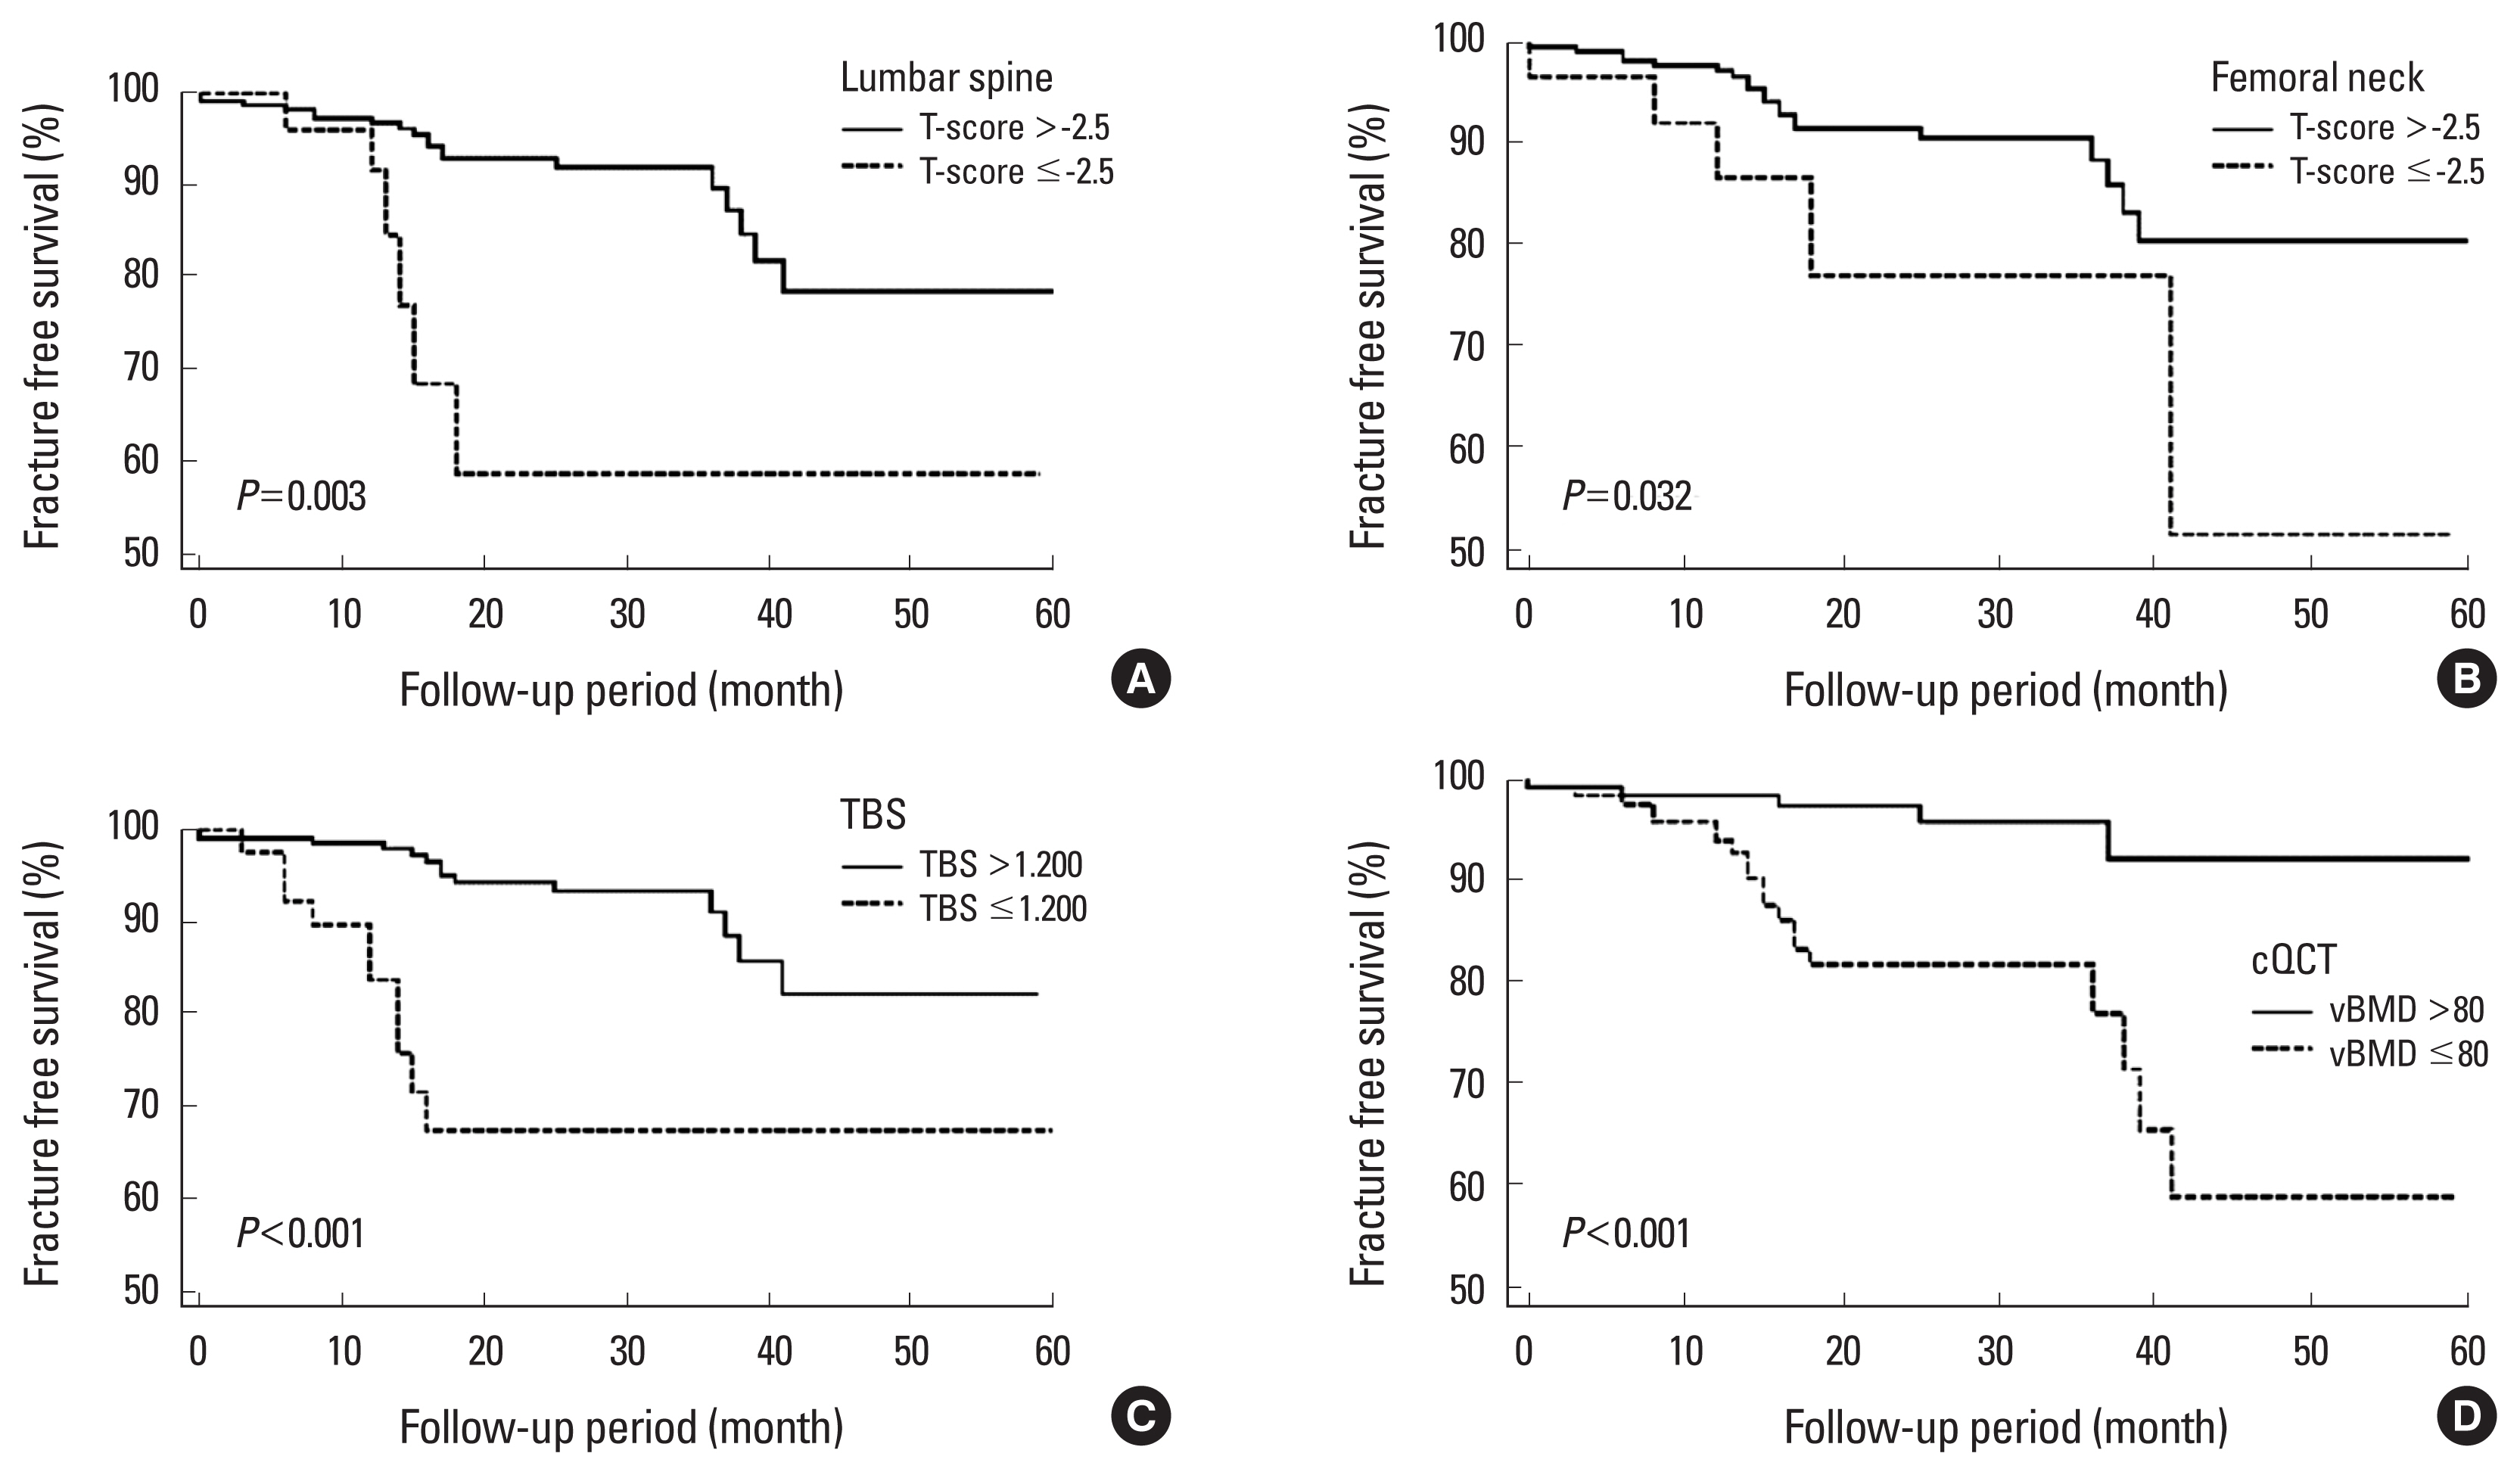
Univariate analyses showed that the existence of baseline CF (hazard ratio [HR], 5.21; P<0.001), diagnosis of osteoporosis based on T-scores of both LS (HR, 1.92; P=0.003) and FN (HR, 2.81; P=0.032), degraded microarchitecture according to the TBS (HR, 5.06; P<0.001), and diagnosis of osteoporosis based on vBMD less than 80 mg/cm3 (HR, 5.35; P<0.001) were significant factors (Table 3) that predicted FFS after initial densitometric assessment (Fig. 2). The final multivariate Cox regression analysis showed that baseline CF (HR, 4.68; P<0.001), degraded microarchitecture according to the TBS (HR, 3.97; P=0.040) and osteoporosis diagnosed by vBMD (HR, 1.89; P=0.040) were independent predictive factors for FFS. T-scores of LS and FN from DXA were not significant predictive factors for FFS after applying multivariate Cox regression analysis (Table 3). In the subgroup analysis of participants with normal BMD or osteopenia, the significant factors were densitometric results but the baseline CF was not for the prediction of future CFs. On multivariate analysis, only TBS was an independent predictive factor for FFS (HR, 13.73; P<0.001) (Table 4).
DISCUSSION
In this retrospective study, prevalence of osteoporosis detected by DXA, TBS, and cQCT was significantly higher in patients with baseline CFs than in those without fractures. The predictive power of future fractures was stronger in cQCT than TBS, followed by DXA, indicating that assessment of bone quality rather than bone mass could be more helpful to predict additional fractures. For future fragility fractures, reduced bone quality as indicated by TBS and cQCT had a significantly increased HR than aBMD measured by DXA at LS and FN. Patients with TBS less than 1.200, LS vBMD less than 80 mg/cm3 and who had baseline CFs showed similar HR for future fragility fractures. TBS was the only significant factor among the densitometric analysis for the future fracture prediction in the subgroup of normal BMD or osteopenia.
Osteoporotic vertebral fractures in participants with osteoporosis are associated with increased mortality, reduced quality of life, and various comorbidities; hence, primary and secondary prevention of fragility fractures is important in the management of osteoporosis.[17,18] To reduce future fragility fracture risk, regular assessment of bone mass using adequate technique is important. Measurement of aBMD, a parameter indicative of bone mass measured by DXA, is used to diagnose osteoporosis and to predict the risk of fragility fracture; however, most fragility fractures occur in participants with values above the osteoporotic range of the aBMD T-score measured by DXA.[19] Consistent with the results of previous studies, more than half of the participants with baseline CFs in this study had a normal or osteopenic range of LS BMD T-scores. Moreover, there are concerns about the overestimation of aBMD measured using DXA associated with spinal degeneration and abdominal aortic calcification.[20] Therefore, providing cooperative techniques to cope with such discordances in aBMD caused by various conditions will be important. Several methods have been proposed to complement aBMD for evaluating bone quality or microarchitecture, which is another determinant of bone strength. In this study, participants with baseline CFs had poorer bone quality (88.1% according to TBS and 82.9% on cQCT) than bone mass (68.4% for LS of aBMD and 80.2% for FN of aBMD). These results are consistent with those of a previous study that compared cQCT and DXA.[9] On the other hand, the CF was not a significant factor in the subgroup analysis with normal BMD or osteopenia, probably because of a too small number of baseline CFs and relatively healthy status of BMD.
Evaluation of bone quality and microarchitecture can also improve fracture risk prediction. In this study, degraded microarchitecture as indicated by TBS and osteoporosis detected on cQCT were associated with an increased risk of future fragility vertebral fracture (HR, 3.97 and 1.89). We also showed the usefulness of TBS and cQCT by analyzing the FFS for fracture risk prediction. Significantly, TBS was more powerful factor with higher HR than vBMD. Moreover, TBS was the only significant predictive factor among the densitometric results for future fracture prediction in participants with normal BMD or osteopenia after multivariate analysis. Probably this is because, in patients with heathy bone status, bone quality counts as a more relevant factor than bone density, whereas QCT indicates bone density. Therefore, TBS could be a more useful tool for patients with osteopenia.[21] Several previous cross-sectional and prospective studies have reported an association between TBS and osteoporotic fracture.[22-24] TBS, easily obtained from DXA images of the LS,[25] predicted the risk of osteoporotic fracture equally as aBMD and its ability of fracture prediction was independent of aBMD.[22] Furthermore, a combination of aBMD and TBS predicted fracture risk more accurately regardless of ethnicity.[24,26]
Previous reports also showed that QCT could predict vertebral fractures better than aBMD-defined by DXA.[27] This is because QCT is less sensitive to changes in bone size than aBMD and can evaluate trabecular and cortical bone compartments separately.[28] A critical disadvantage of QCT is the increased burden of radiation exposure compared to that with DXA.[28] In recent times, opportunistic cQCT-acquired vBMD from pre-existing CT scans performed for other medical conditions could be useful for fracture risk prediction.[29] Moreover, a meta-analysis of high-resolution peripheral QCT (HR-pQCT) using a low radiation dose demonstrated its ability to predict fracture risk.[30] Therefore, opportunistic cQCT and HR-pQCT are alternative methods with no risk of radiation exposure.
This study had some limitations. First, this was a retrospective single-center study. There was a probability of selection bias, and the results of this study cannot be generalized. Second, the diagnosis of fragility fracture of vertebra is usually based on radiography of the TLS; thus, there are potential missing events of fragility fractures at other sites. Third, in this study, we mainly focused on patients’ densitometric results, other than osteoporosis medication which they taking or biochemical data including bone turnover markers. Incorporating all other data would result in more complicated outcomes.
Nonetheless, in this study, by applying volumetric bone analysis through cQCT and TBS which reflects microarchitecture, our data showed a good prediction of future fragility fracture risk with reliable statistical significance. In clinical settings, additional analysis with cQCT and TBS may be a good guide for the prediction of future fragility fracture particularly with patients who have high fracture risk. Furthermore, densitometric assessment of bone analysis could help diagnosis in patients whose single aBMD and fracture risk are discordant, especially for the patients whose aBMD is in osteopenic range.
In conclusion, evaluation of LS and FN using densitometric analysis with DXA has less predictive power for future VFFs. Therefore, using the vBMD or TBS from specific modalities could provide a more accurate prediction of future VFFs.
 PDF Links
 PubReader
 ePub Link
 Full text via DOI
 Download Citation
 Print
Print