The 2nd Metacarpal Cortical Index as a Simple Screening Tool for Osteopenia
Article information

Abstract
Background
Osteopenia is a known risk factor for sustaining skeletal fractures. Prevention of fragility fractures has obvious clinical and economic advantages, however screening all patients using a dual energy X-ray absorptiometry (DXA) is controversial not only because of the cost implications but also because it would potentially involve exposing a percentage of normal patients to unnecessary radiation. We wished to assess whether a simple hand X-ray measuring the 2nd metacarpal cortical index (2MCI) could be used as a simple screening tool for identifying patients with osteopenia.
Methods
We retrospectively collected the radiographic data of 206 patients who had a simple radiograph of the hand and a DXA scan within one year of each other from our picture archiving and communication system database. The 2MCI was calculated for all patients. As data was parametric, a Pearson’s correlation was performed to assess association between T-scores and 2MCI. Further analysis involved the construction of receiver operating characteristic (ROC) curves to identify a 2MCI index, which would give the most appropriate sensitivity and specificity values for identifying the presence of osteopenia.
Results
A statistically significant and moderate correlation between DXA T-scores and 2MCI values was found (r=0.54, n=206, P<0.001). Further ROC curve analysis of normal and osteopenic subjects identified that a 2MCI of 41.5 had a sensitivity of 100% and specificity of 53% for detecting osteopenia.
Conclusions
Our results support the use of the 2MCI as a simple screening tool for identifying patients with osteopenia.
INTRODUCTION
Osteoporosis is a metabolic condition in which there is a loss in bone mass, causing bone to become brittle and fracture easily. The current prevalence of osteoporosis is approximately 3 million in the United Kingdom,[1] causing over 300,000 fragility fractures per year.[2] The most common fragility fractures occur at the wrist, vertebra and hip.[3] Every year, hip fractures cause 69,000 admissions in England,[4] costing the National Health Service (NHS) roughly £1.8 billion in the year 2000. This cost is predicted to rise to £2.2 billion by 2025.[5] Females aged between 65 and 74 years of age who have sustained a fracture to their wrist are 3 times more likely to develop a hip fracture than in the general population. This figure is 6 times more likely in men.[6] Osteopenia is a precursor to osteoporosis, and thus preventing the progression of osteopenia to osteoporosis may help in preventing fragility fractures.
Currently, the dual energy X-ray absorptiometry (DXA) scan is the gold standard investigation for osteoporosis in the UK. This is advised in people older than 50 years with a fragility fracture, or younger than 40 years old with a risk factor for fragility fractures.[7] Osteoporosis is said to be a systemic disease affecting the whole skeleton.[8] Bone mineral deficiency leading to osteopenia can result in thinning of cortical bone and the ratio of medullary cancellous to cortical bone changes. The second metacarpal bone is relatively cylindrical and thus X-rays taken from different aspects give relatively consistent cancellous to cortical bone ratios. Therefore, radiographs of the 2nd metacarpal can be used to calculate the cortical index and in theory may be used to predict deficient bone mineral density (BMD) conditions. Some studies have found that computed tomography (CT) and magnetic resonance imaging scans can be used for screening osteoporosis.[9,10] However, radiographs are readily available, cheap and the 2nd metacarpal is included in X-rays of the hand, wrist and elbow. So far, there is limited research assessing the value of using plain radiographs to assess for BMD deficiency diseases. However, a recent study has found a significant correlation between BMD and 2nd metacarpal cortical percentage.[11] Another study has also demonstrated a correlation between BMD and mandibular cortical indexes in India.[12] Furthermore, the cylindrical shape of the 2nd metacarpal has been shown to minimise measurement inconsistencies from X-rays taken from slightly different angles.[11]
We therefore aimed to assess if simple radiographs which include the 2nd metacarpal could be used to predict the presence of osteopenia.
METHODS
1. Study cohort
We retrospectively collected radiographic data of 206 patients, who had a simple radiograph of the hand and DXA within one year of each other. These images were obtained from our picture archiving and communication system (PACS) database. Inclusion criteria consisted of patients over the age of 50 years who had both a hand radiograph and DXA between September 2015 and September 2018. Patients with suboptimal X-rays, those with a plaster or metal work obstructing the 2nd metacarpal, and those who had more than 1 year between X-ray and DXA, were excluded. The 222 patients were initially identified, and following application of exclusion criteria, 206 patients remained.
2. Second metacarpal cortical percentage calculation
Posteroanterior views of the 2nd metacarpal were used to calculate the 2nd Metacarpal Cortical Index (2MCI) by one observer. This was calculated by measuring the diameter of the mid diaphysis at the narrowest point (A). A second measurement was taken from the intramedullary part at the same point (B) (Fig. 1). The formula [(A-B)/A]*100 was used to calculate the 2MCI. The 2MCI was not re-measured by an independent observer.
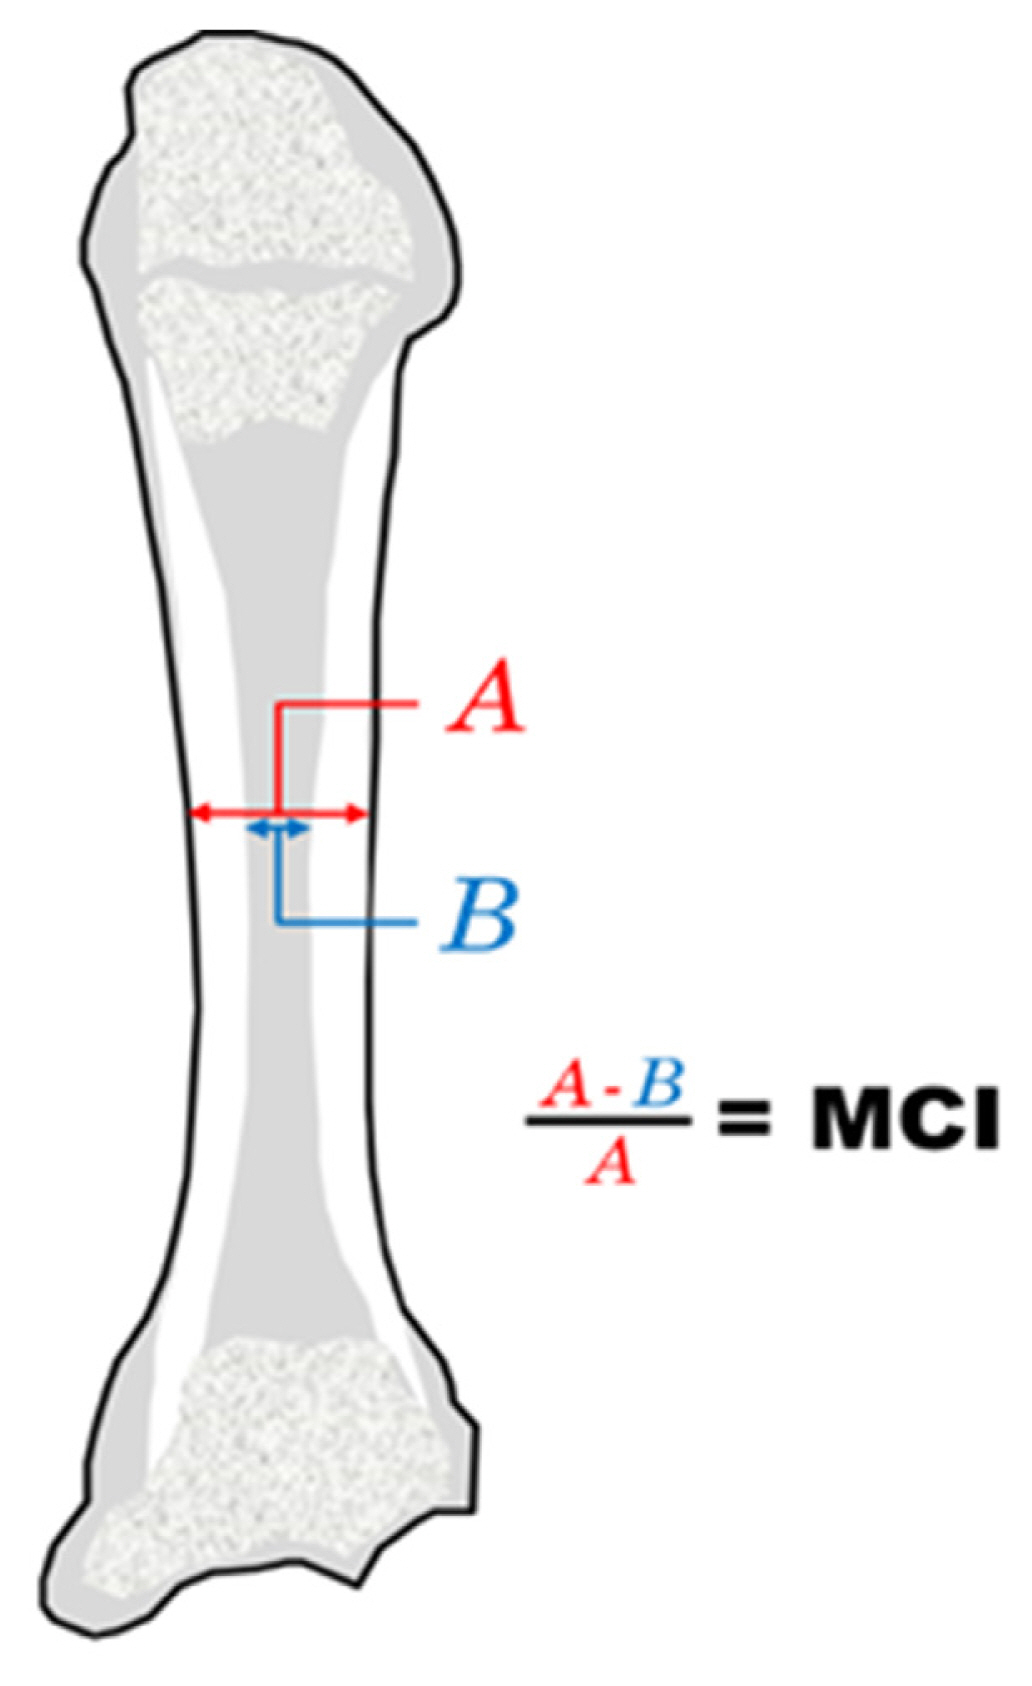
Demonstration of the calculation of 2nd metacarpal cortical index (2MCI).
3. Statistical analysis
The 2MCI and DXA hip T-score data were initially examined using producing histograms. We found no difference between 2MCI and spine DXA scores and therefore used hip T-scores only for simplicity. The data visually approximated well to normality curves. To confirm data was parametric, Kolmogorov-Smirnov and Shapiro-Wilk tests were performed and Q-Q plots were constructed.
A Pearson correlation test was performed to measure the potential association between the 2MCI and DXA T-Scores. A 2-tailed test was carried out and the 95% confidence interval was deemed as significant.
Following this receiver operating characteristic (ROC) curves were constructed using DXA T and 2MCI scores as the test and state variables. As we wished to use the 2MCI as a potential screening tool for osteopenia, the optimum 2MCI cut off value was deemed as that where a sensitivity of 100% was evident with the highest possible specificity.
RESULTS
This study investigated 206 patients, of which 178 were female and 28 were male. The mean age was 69+10 years and ranged from 51 to 93. Eighty-eight patients were osteopenic (−2.5> hip T score <−1), 33 were osteoporotic (hip T score <−2.5) and 85 patients had a hip T score greater than −1. The mean hip T-score was −1.3+1.2 (range, −4.9 to 2.3) and mean 2MCI was 0.48+0.11 (range, 0.2–0.8). The average time between hand X-ray and DXA scan was 80 days+50 (range, 0–218 days).
Both 2MCI and DXA hip T-scores were found to approximate well to a gaussian distribution on drawing histograms, Q-Q plots and on Kolmogorov-Smirnov testing [2MCI: D(206) =0.03, 0.2 and DXA T score: D (206)=0.05, 0.2].
A Pearson correlation test revealed a moderate and significant correlation between DXA hip T and 2MCI scores (r=0.54, n=206, P<0.001) (Fig. 2). A 2MCI value of 41.5 showed 100% sensitivity and 53% specificity for detecting osteopenia (Fig. 3).
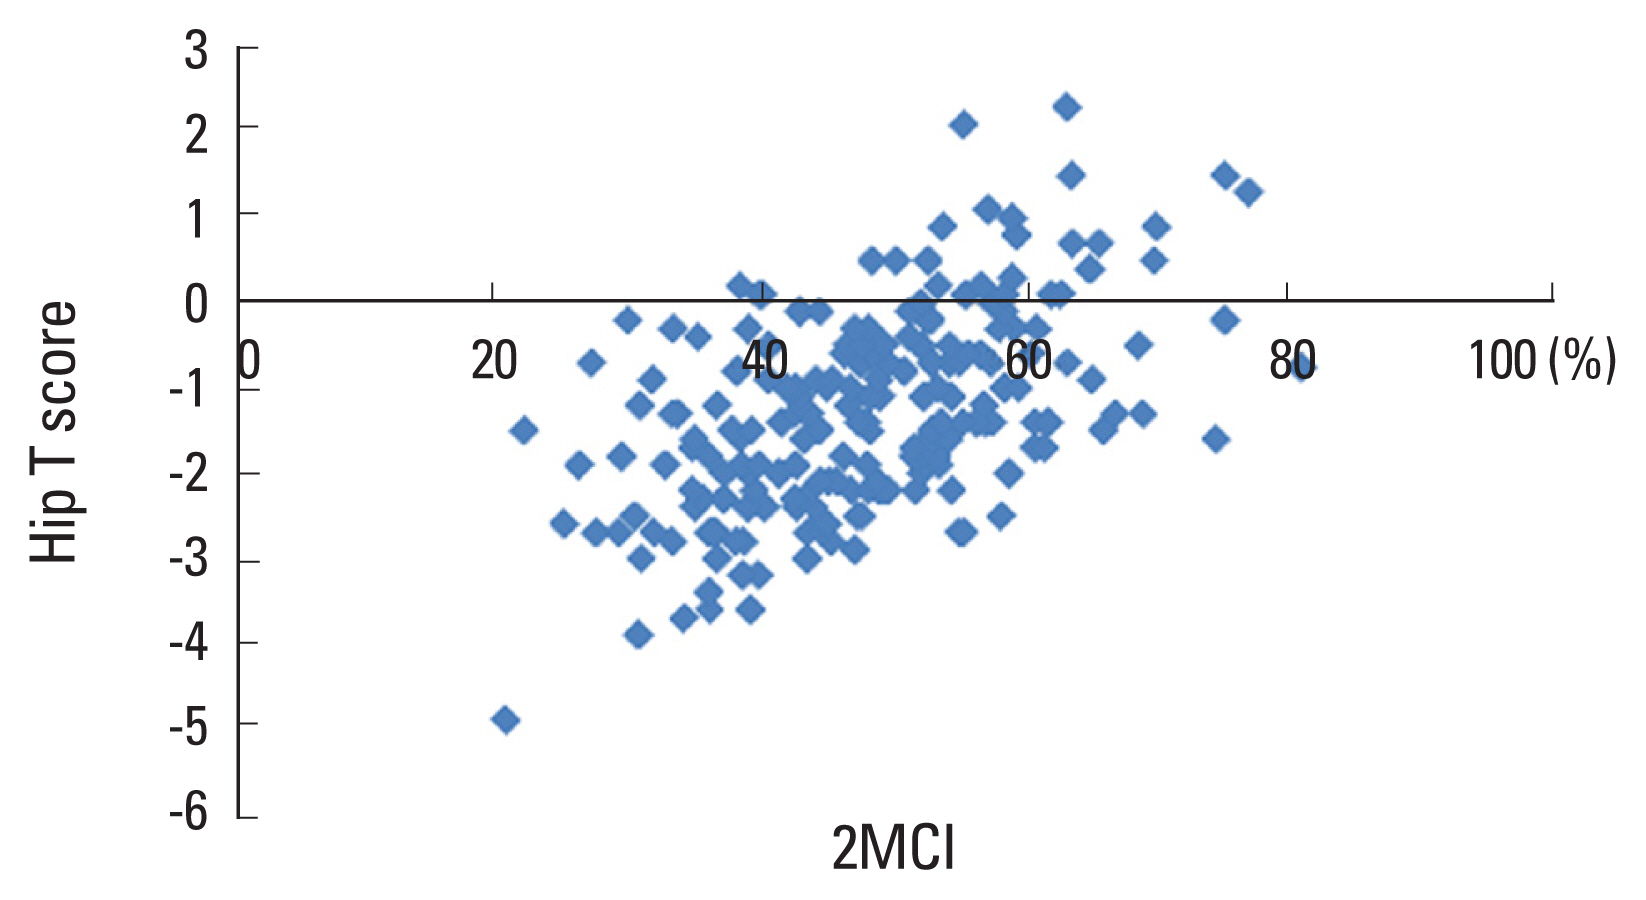
A scatter graph showing the correlation of 2nd metacarpal cortical index (2MCI) with Hip T score. A significant correlation was found (r=0.54, n=206, P<0.001).

A receiver operating characteristic (ROC) curve showing sensitivity and specificity values for 2nd metacarpal cortical index as a predictor for osteopenia (area under curve=0.63).
DISCUSSION
This study has demonstrated that the 2MCI can be used to identify patients with osteopenia. DXA scan is the gold standard for screening for osteopenia and osteoporosis, and a statistically significant correlation was found between DXA hip T-score and 2MCI. A 2MCI value with 100% sensitivity and 53% specificity for osteopenia was found, indicating that this method could be an effective screening tool.
This is the first study to identify a way of using this tool in identifying patients in the pre-osteoporotic state (i.e., osteopenia). This method would be simple, widely available and inexpensive. The results would also be quickly and easily accessible. Measuring the 2MCI is a recognised technique to identify patients with osteoporosis since 1960. Quantitative evaluations of hand radiographs have been used to investigate the association between cortical thickness and osteoporosis, and a positive relationship between metacarpal bi-cortical thickness and femoral bone density on DXA using PA radiographs of the hand has been demonstrated.[13] However, the precision of this technique was initially poor (coefficient of variation 8%–12%), due to the use of measuring errors from using non-digital radiographs. The technique was rejuvenated in 2000 with the application of modern computer vision technology.[14] A further study in 2017 found a correlation between the metacarpal cortical percentage with a value of less than 50% showing 100% sensitivity and 91% specificity for osteoporosis.[11] Further studies have demonstrated radiographic quantitative indices as screening tools for osteoporosis,[15–17] and other studies have found a correlation between proximal humeral cortical thickness and DXA scores.[18,19]
Other imaging modalities including X-ray radiogrammetry and quantitative CT have also been investigated as alternative diagnostic tools to address population screening.[20] Radiogrammetry (DXR) is one way of assessing bone density using computer software to calculate measurements based on simple radiographs.[21] The use of the 2MCI, on the other hand, does not require the use of specialised computer software.
Despite these alternative attempts to evaluate BMD and fracture risk, the method recommended by the World Health Organisation (WHO) for diagnosis of osteopenia and osteoporosis is the measurement of BMD by DXA scans.[22] Currently the DXA method is widely applied and has very reliable outcomes in identifying individuals with low BMD at the hip and vertebrae.
This study has shown a 2MCI of 41.5 leads to 100% sensitivity for identifying osteopenic subjects. The ability to identify osteopenia before progression to osteoporosis would allow more expedient treatments and may reduce the incidence of fragility fractures. The accuracy of the radiographic measurements depends on the digital images PACS system with measurement and magnification functions. While we have not tested intra- and inter-observer reliability in this study, digital radiographic measurements have been shown in another study to have a high intra-observer and inter-observer reliability which suggests that this technique would be reproducible.[22]
In many patients, osteopenia and osteoporosis is only diagnosed at the point of the complication of a fragility fracture. Opportunistic radiographic assessment of the 2MCI when a patient presents to a hand clinic or minor injury unit could identify patients at risk of developing osteoporosis at no extra cost to the NHS. These patients could then be referred to either primary care or fragility clinics to obtain lifestyle advice or to have further screening or treatment as necessary prior to them sustaining a fragility fracture.
In practice, screening tests exhibit false positives and false negatives. Our study shows a 2MCI of 41.5 leads to 100% sensitivity with 53% specificity for osteopenia. This value can allow clinicians to assess the patient and then as appropriate, refer for a DXA scan to detect osteoporosis. The false positive patients during this process can be identified and excluded without receiving treatment.
The limitations of our study included its retrospective nature and study size; a large cohort with multi centred patients would result in a more robust study. While we did not record the ethnicity of our sample, the study was carried out in Bradford Royal Infirmary, which is known to have an ethnically diverse urban population. Future studies could further validate or findings from different patient groups. In order to maximise the number of osteopenia X-rays in our cohort, we limited our selection to patients more than 50 years of age. We accept therefore that our results and conclusions therefore might not be applicable to younger patients. However, it is less likely that younger patients would have BMD related diseases. This study is also limited by not considering patient comorbidities such as rheumatoid arthritis, which may also affect the 2MCI cortical thickness. We also accept that minor degrees of rotation of the hand during radiographs may marginally affect the ratio described. However, as the metacarpal roughly cylindrical shaped at the mid-level other studies have found rotational malposition of the hand during the X-ray process has found not to have a negligible effect on 2MCI measurements. There is also the possibility that a patient’s BMD/T-score may have altered between having X-rays and the DXA scan. However, as part of our inclusion criteria, we limited the interval between the 2 scans in order to reduce this impact. In fact, the average time difference between investigations was less than 3 months and at maximum just over 7 months.
CONCLUSIONS
This study suggests that the 2MCI appears to be a simple and effective method for identifying patients with osteopenia, and therefore could be particularly useful in the identification of patients who would benefit from treatment preventing future pathological fractures. External validation on prospective data in the future would be useful to further validate our findings.
Notes
Ethics approval and consent to participate
This study was conducted according to the principles expressed in the Declaration of Helsinki.
Conflict of interest
No potential conflict of interest relevant to this article was reported.