Characteristics of Appendicular Tissue Components in Patients with Rheumatoid Arthritis
Article information

Abstract
Background
The purpose of this study was to identify the characteristics of appendicular lean mass (ALM) associated with rheumatoid arthritis (RA) and to analyze appendicular tissue components in patients with RA.
Methods
We prospectively reviewed of patients with RA who underwent dual energy X-ray absorptiometry in a single center. From data of 28 patients, ALM was calculated. Regression analysis was used to investigate the association between ALM and RA. Using propensity score matching, patients with RA were compared to the control group from 18,698 patients of Korea National Health and Nutrition Examination Surveys data. RA and control group were matched in a 1: 5, respectively.
Results
In regression model, there was significantly negative association between disease activity score and ALM index in patients with RA in unadjusted (β=−0.387, 95% confidence interval [CI], −0.729 to −0.045) and model adjusted for age, sex, and body mass index (β=−0.227, 95% CI, −0.451 to −0.003). In matching with age and sex, the arms fat mass and fat fraction of RA group were significantly lower than that of control group. In matching with age, sex, and body mass index, the ALM index and legs lean mass of RA group were significantly higher than control group.
Conclusions
Patients with RA have a lower ALM with higher disease activity. In addition, we found that patients with RA had different tissue component in arms and legs compared to general population.
INTRODUCTION
Sarcopenia is related to daily life disability, and is an independent risk factor of falls in older people, and premature mortality.[12] It is mainly observed in older people, but it can also appear in younger adults in the course of many clinical conditions.[3] In patients with rheumatoid arthritis (RA), decrease of muscle mass have been observed in studies.[45] The main causes of lean body mass decrease in the course of RA are chronic inflammation accompanying the disease, decrease in physical activity, chronic pain, and increase of energy expenditure during rest.[6]
Patients with RA were also associated with risk of overfat and obesity.[57] In addition, adiposity is important confounder in estimating muscle mass because there is a strong positive association between skeletal muscle mass and fat mass.[89] Baker et al. [4] estimated the appendicular lean mass (ALM) adjusting for adiposity. They suggested that increasing fat mass was associated with disability and strong associations between ALM and functional outcomes. Therefore, not only muscle mass but also fat mass assessment is important to analyze appendicular tissue component of patients with RA.
The purpose of this study is to find significant factors related to ALM in patients with RA and determine difference of appendicular tissue component between patients with RA and general population.
METHODS
1. Study design and participants
We prospectively collected patient's data between March 2018 and February 2019 in a single center. Patients previously diagnosed with RA according to the 2010 RA classification criteria [10] and underwent dual energy X-ray absorptiometry (DXA) were included. The Inje University Seoul Hospital institutional review board approved this study (PAIK 2018-04-003). Informed consent was obtained from all RA patients included in the study.
Clinical characteristics including age, sex, body mass index (BMI), rheumatoid factor, anti-cyclic citrullinated peptide antibody, disease activity score (DAS) 28,[11] current medication including glucocorticoid, disease modifying anti-rheumatic drugs, biologics, osteoporosis medication. All patients underwent DXA. Bone mineral density (BMD) was obtained at lumbar spine and one proximal femoral area (Lunar Prodigy Advance; GE Lunar, Madison, WI, USA). T-score at total spine, total femur, femur neck was measured. From the report of soft tissue content, we obtained fat and lean mass (kg) of arms and legs. Using the information, we calculated fat fraction of soft tissue (%) and ALM index (ALM/height2). Adjusted criteria considering Asian low muscle volume were conducted for sarcopenia (male <7.00 kg/m2, female <5.40 kg/m2).[12]
2. Definition of control group
We used data of the Korea National Health and Nutrition Examination Survey (KNHANES) as control group. This nationally representative cross-sectional survey includes approximately 10,000 individuals each year as a survey sample and collects information on socioeconomic status, health-related behaviours, quality of life, healthcare utilization, anthropometric measures, biochemical and clinical profiles for non-communicable diseases and dietary intakes with 3 component surveys.[13] In the data, appendicular tissue mass including fat and lean mass and BMD measured with DXA (QDR 4500A; Hologic Inc., Bedford, MA, USA) were obtained for 2008 to 2011. We extract data of age, sex, BMI, fat and lean mass, BMD from KNHANES data. We obtained control group of 18,698 individuals.
3. Statistical analysis
Clinical characteristics of patients with RA was shown as mean with standard deviation (SD) or median with interquartile range (IQR). We used the linear regression to assess the association between ALM index and variables in patients with RA. We also calculated the β coefficients adjusting age, sex, and BMI. Using RA and control group, a nearest-neighbor propensity score matching was conducted in a 1:5 using a 0.05 caliper (Fig. 1). We created 2 model; model 1 matching variables with age and sex and model 2 matching variables with age, sex, and BMI. The absolute standardized mean differences of the variables used for matching were all less than 0.1 (Fig. 2). The Pearson χ2 test or Fisher's exact test was used for categorical variables. After normality was tested using the Shapiro-Wilk test, the Student t-test or the Mann-Whitney U test for continuous variables were used for comparison between groups. All P values of less than 0.05 were assumed to indicate statistical significance. All statistical analyses were performed with R (version 3.6.0; The R Foundation for Statistical Computing, Vienna, Austria).
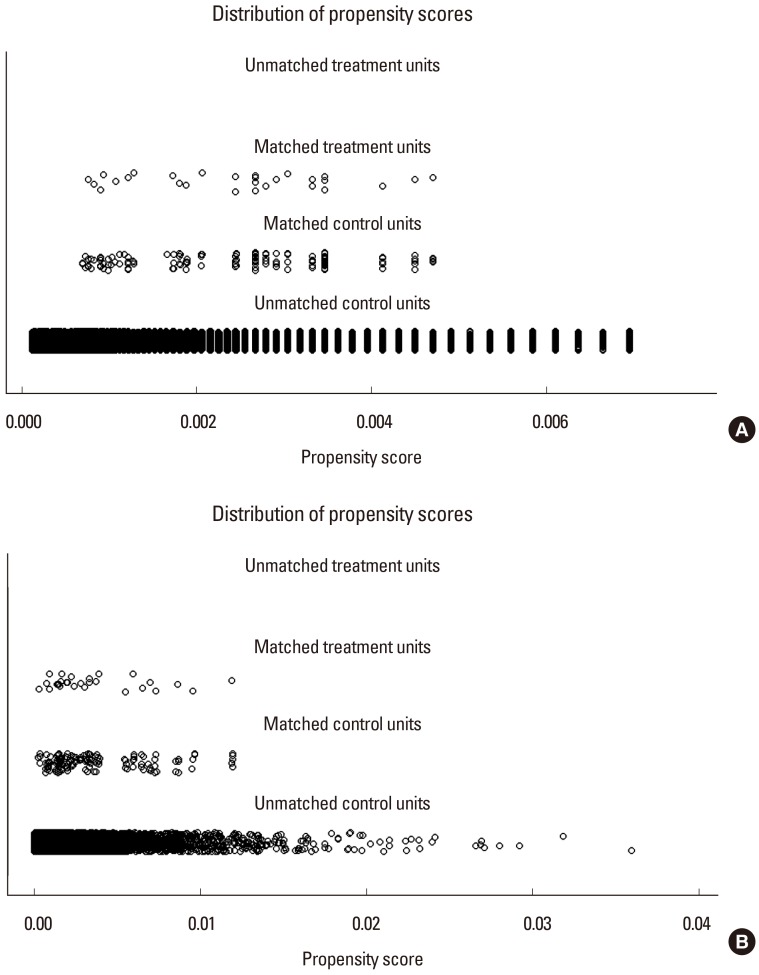
Nearest neighbor propensity score matching (A) with age, sex and (B) with age, sex, and body mass index.

Absolute standardized mean difference of matching (A) with age, sex and (B) with age, sex, and body mass index. The dashed line is standardized mean difference 0.1.
RESULTS
1. Baseline clinical characteristics
Table 1 summarizes the clinical characteristics of patients with RA. The mean age was 58.5±8.9 years. The proportion of female was 78.6%. The mean BMI was 21.8±3.2 kg/m2. In most patients, erythrocyte sedimentation rate (24.5 [11.0; 50.0] mm3/hr) and C-reactive protein (CRP; 0.2 [0.2; 0.6] mg/dL) did not indicate high inflammation. The mean DAS 28 was 2.3±1.0 with remission status. The 17, 8, and 3 patients were in remission, low disease activity and moderate disease activity, respectively. Health assessment questionnaire (HAQ) score was 0.1 (0.1; 0.2) with very low value. Most patients (96.4%) were treated with disease-modifying antirheumatic drug and 28.6% were treated with biologics. The mean BMD of spine and femur showed osteopenia and there were 15 and 5 patients diagnosed with osteopenia and osteoporosis, respectively. The mean fat fraction of arms and legs was 30.5±11.9 kg and 30.6±11.0 kg, respectively. The mean ALM index was 6.3±1.0 kg/m2 and 6 patients (21.4%) were classified as sarcopenia in patients with RA.
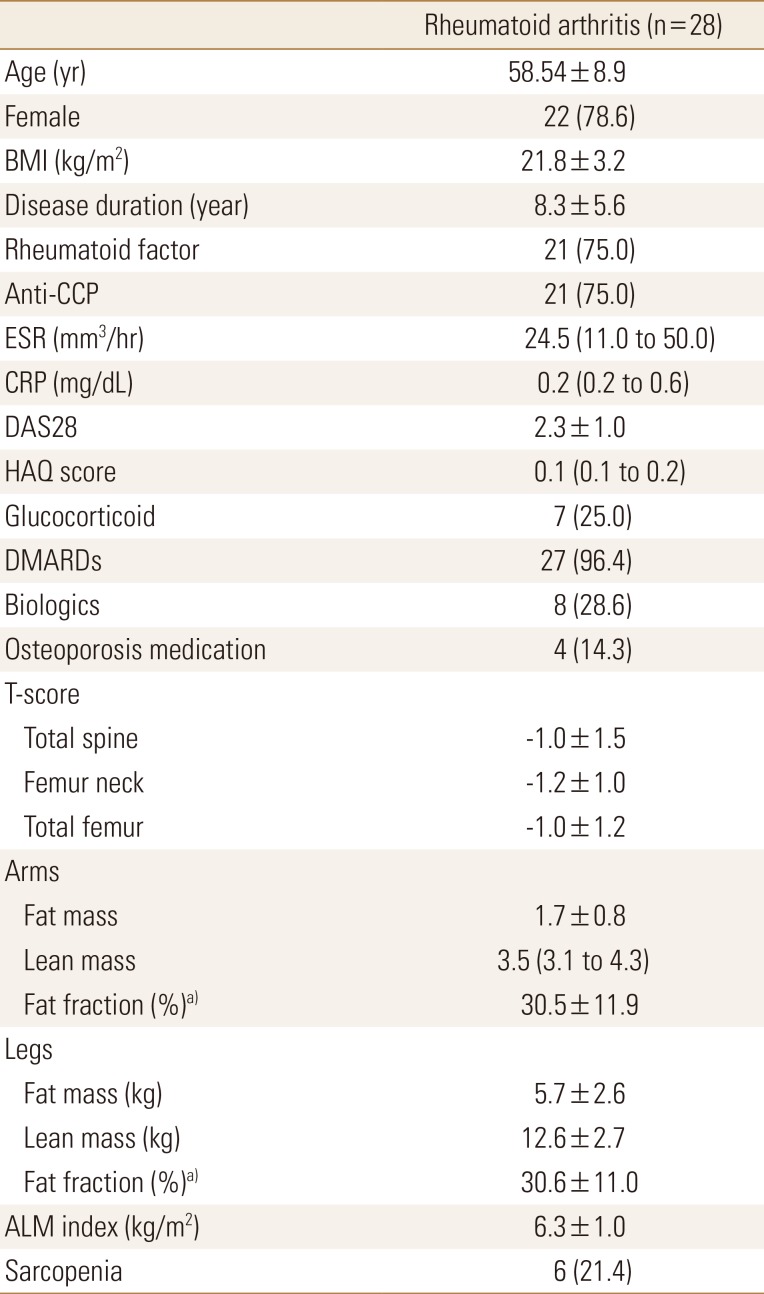
Baseline characteristics of patients with rheumatoid arthritis
2. Variables associated with ALM index
Table 2 showed the association between ALM index and other variables. In unadjusted model, ALM index were significantly lower in female compared to that in male (β=−1.575, 95% confidence interval [CI], −2.246 to −0.903) and negatively associated with disease duration (β=−0.069, 95% CI, −0.133 to −0.006), DAS28 (β=−0.387, 95% CI, −0.729 to −0.045), and log-scaled HAQ score (β=−0.691, 95% CI, −1.222 to −0.159). Among BMD, T-score at total femur showed a positive correlation (β=0.349, 95% CI, 0.047 to 0.651). In association between body mass and ALM index, the ALM index was positively correlated with the lean mass on arms and legs (β=0.837, 95% CI, 0.621 to 1.052 and β=0.331, 95% CI, 0.276 to 0.386, respectively), negatively correlated with the fat fraction (β=−0.034, 95% CI, −0.064 to −0.005 and β=−0.043, 95% CI, −0.073 to −0.012, respectively).
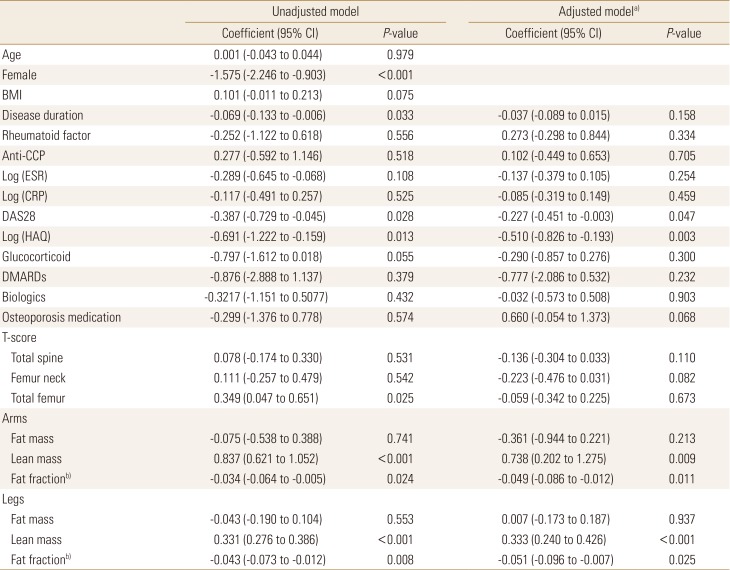
The association between appendicular lean mass index and other variables in patients with rheumatoid arthritis (n=28)
In adjusted model with age, sex, and BMI, DAS28 and HAQ was significantly associated with ALM index (β=−0.227, 95% CI, −0.451 to −0.003 and β=−0.510, 95% CI, −0.826 to −0.193). There was not significantly association between ALM index and BMD. The ALM index on arms and legs showed significant association with the lean mass (β=0.738, 95% CI, 0.202 to 1.275 and β=0.333, 95% CI, 0.240 to 0.426, respectively) and the fat fraction (β=−0.049, 95% CI, −0.086 to −0.012 and β=−0.051, 95% CI, −0.096 to −0.007, respectively).
3. Different tissue component between RA and control group
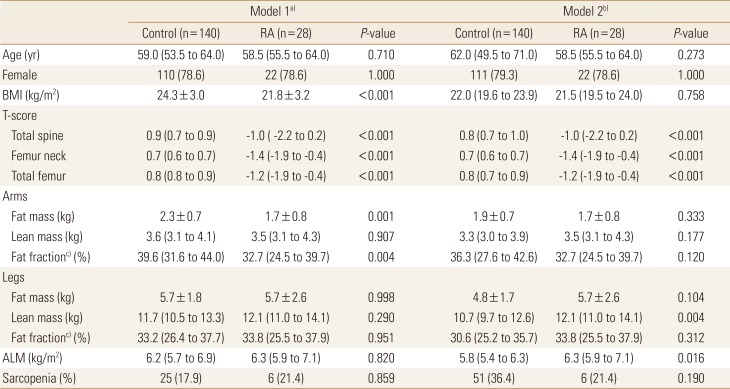
We used propensity score matching to obtain the control group from KNHANES data (Table 3). Table 4 showed comparison between control (n=140) and RA group (n=28). In model 1 matched with age and sex, RA group was significantly low BMI and low T-score at spine and femur. RA showed different tissue component from control group that low fat mass (1.7±0.8 vs. 2.3±0.7, P=0.001) and low fat fraction (32.7 [24.5; 39.7] vs. 39.6 [31.6; 44.0], P=0.004) in arms, but there was no significantly difference in fat mass in legs, lean mass in arms and legs, ALM index, and the proportion of patients with sarcopenia.
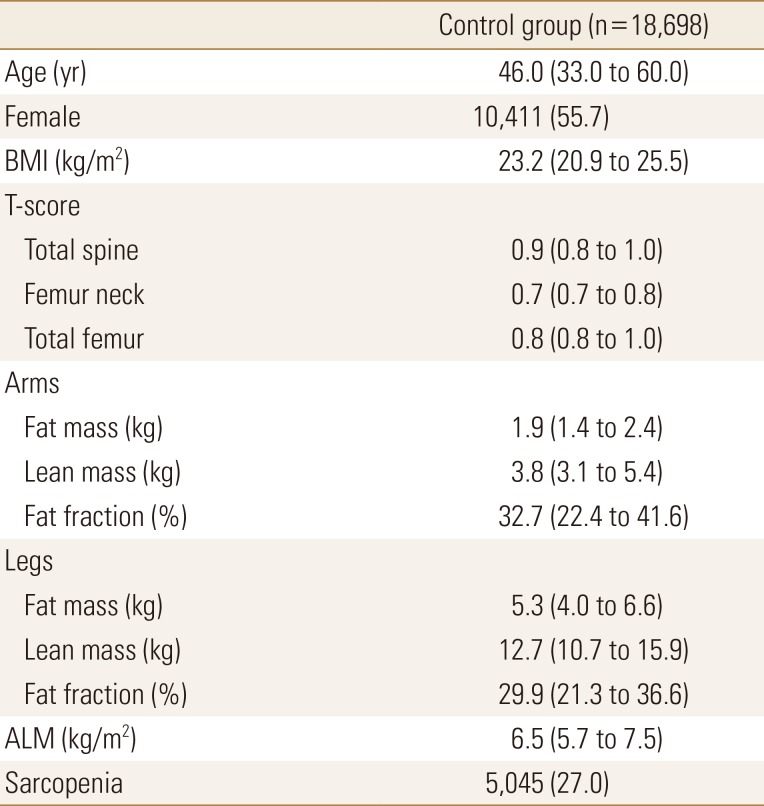
Clinical characteristics of control group from the Korea National Health and Nutrition Examination Survey
Propensity score matching between patients with rheumatoid arthritis and patients from the Korea National Health and Nutrition Examination Survey
In model 2 matched with age, sex and BMI, we also observed that lower T-score of RA group compared to control group. There were no significant difference of fat and fat fraction between control and RA group. However, we observed that RA group had higher lean mass in legs and ALM index compared to control group (12.1 [11.0; 14.1] vs. 10.7 [9.7; 12.6], P=0.004 and (6.3 [5.9; 7.1] vs. 5.8 [5.4; 6.3]), P=0.016, respectively). There was no significant difference in the proportion of patients with sarcopenia.
DISCUSSION
We found that the higher the disease activity, the lower the ALM index in patients with RA. This may indicate that disability due to inflammatory cytokines or increased disease activity associated with RA may affect muscle mass. In addition, when compared to the general population with adjusting age and sex, patients with RA showed no difference in muscle mass but low fat. Taken together, pathophysiology of RA may affect the muscle and fat component of body.
Giels et al. [5] showed that rheumatoid factor positivity, increasing joint deformity, HAQ score, and CRP level was associated with abnormal body composition, but not DAS28 score. Munro and Capell [14] also showed that there was negative correlation between serum CRP level and muscle mass in women with RA. Our study also showed that RA disease activity and functional score were significantly associated with muscle mass in the association between ALM and DAS28 and HAQ.
In comparison between RA and control group, we did not find difference in ALM index in adjusted model with age and sex. Considering that DAS28 and HAQ are low values, ALM may not make much difference in the 2 groups. However, in adjusted model with age, sex, and BMI, we identified that the lean mass in legs and ALM index increased in RA group than in control group. As a result, it was confirmed that tissue component in patients with RA was significantly different from general population. Interestingly, Patients with RA seems to have lower fat mass in the arms and higher lean mass ratio in the legs than the general population. We suggested that fat mass ratio might be affected differently by arms and legs. Further research on RA and fat metabolism is needed.
It has been well known that Inflammatory cytokines are associated with muscle wasting in diseases, such as cancer, heart disease, and sepsis.[15] In addition, inflammatory cytokines such as interleukin-6 (IL-6) and tumor necrosis factor were associated with reducing muscle mass.[1617] In RA, Kramer et al. [18] suggested that higher tender joint count and serum IL-6 level was significantly associated with lower thigh muscle density using thigh computed tomography. In addition to the ALM index showing a deep association with disease activity in our study, it appears to show strong association between the pathophysiology of RA and muscle.
Our study had several limitations. First, this is cross-sectional study. In the longitudinal cohort, the measurement of ALM with RA and disease progression may provide a clearer relationship between disease activity and ALM. Second, we used KNHANES data as a control. Although similar patients were matched using propensity score, the timing and method of examination may differ. Third, we measured muscle mass but not muscle quality. By adding physical capacity or ability, we may add more information about the body component in patients with RA.
CONCLUSIONS
The appendicular muscle mass and disease activity were negatively correlated in patients with RA. In addition, appendicular tissue component may differ from the general population.
Acknowledgments
Database of the Korea National Health and Nutrition Examination Surveys was provided by the Korea Centers for Disease Control and Prevention. The authors would like to thank the Korea Centers for Disease Control and Prevention. This work was supported by the 2018 Inje University research grant.
Notes
Ethics approval and consent to participate: This study was conducted according to the principles expressed in the Declaration of Helsinki and was approved by the Inje University Seoul Hospital Research Ethics Committee (IRB No. PAIK 2018-04-003).
Conflict of interest: No potential conflict of interest relevant to this article was reported.