


INTRODUCTION
It is estimated that the population aging in Korea is getting more progressed from 10.2% in 2005 to 35.6% in 2045, and the progress rate of aging is the fastest among Organisation for Economic Co-operation and Development countries.[1] Therefore, healthcare for the elderly aged 65 or older is very important at the national level beyond the individual perspectives. In the process of aging, muscle loss is known to progress gradually from their 40s, and the elderly suffer from changes in body composition such as a decrease in muscle mass and an increase in body fat mass as well as deterioration of the muscle quality.[2,3] This not only interferes with protein metabolism in the muscles but also cause insulin resistance.[4]
Nutrition issues are somewhat different according to age group. While overnutrition or nutritional imbalance are the issues among young adults, the elderly people still have a deficiency of food and nutrient intake.[5] Sarcopenia refers to a decrease in muscle mass and muscle strength, which is common in weak elderly people who have less physical activity and exercise, and poor nutrition.[6] Malnutrition caused by decrease in nutrient intake promotes the progression of sarcopenia.[7] Previous studies on the association between sarcopenia and nutrients showed that inadequate protein intake negatively affected the synthesis of muscle proteins in the elderly.[8,9] It is reported that the highest protein intake group had about 40% less muscle loss than the low protein intake group.[8] Muscle loss is accompanied by a decrease in the vitamin D receptor in the muscle, so increasing the level of vitamin D in the blood is an important factor in maintaining high muscle mass.[10] In addition, the concentration of antioxidants in the blood is positively correlated with physical activity and muscle strength, and the effects of leucine, which positively affects muscle protein synthesis, can be inhibited by oxidative stress, which can be improved by antioxidant nutrients.[11,12] As a result, when there are various kinds of foods that contain enough nutrients, it is possible to consume balanced nutrients. Many studies have been conducted on the nutritional intake of the elderly in Korea, but few studies have been conducted on sarcopenia.
The purpose of this study was to examine the sarcopenia status of the elderly and to analyze the qualitative aspects of diet through the evaluation of food diversity according to the sarcopenic status and to provide the basic data necessary for setting guidelines for the reduction of muscle.
METHODS
1. Study subject
This study used the data of 2008 to 2011 Korea National Health and Nutrition Examination Survey (KNHANES), which contain the body composition data which are required to calculate muscle mass. The subjects of the study were the elderly over 65. A total of 3,350 people were extracted, by excluding those under 65 years of age, those who had missing analytical variables, or those whose daily calorie intake is less than 500 kcal or over 5,000 kcal. Out of the subjects, males were 42.6%, and females were 57.4%. A total of 862 suspected sarcopenia were classified. The method proposed by Janssen et al. [13] was used as a standard of diagnosis of sarcopenia. When the muscle mass excluding bones and fats of limbs measured by dual energy X-ray absorptiometry (DISCOVERY-W; Hologic Inc., Bedford, MA, USA) divided by weight in the form of percent is under the twice of standard deviation (SD), it was classified as sarcopenia.[14]
2. Study variables
In body mass index (BMI), household income (low, middle-low, middle-high, high), marital status (married, single), education level (elementary school or below, middle school, high school, university or above), smoking status (current smoker, past smoker, no smoker), alcohol consumption (yes or no), activity limitation (yes or no) and subjective health status (good, so-so, bad) were used as demographic factors and lifestyle data in the KNHANES. Marriage variable in the marital status includes current marriage, separation, divorce, and bereavement.
Food intake analysis is based on the guideline of 15 food groups (cereals, potato and starches, sugars and sweeteners, pulses, nuts and seeds, vegetables, fungi and mushrooms, fruits, meats, eggs, fish and shellfishes, seaweeds, milks, oil and fat, and beverages).[15] The number of foods consumed during the day was calculated.[15] This is called the dietary variety score (DVS) and is a tool for evaluating the variety of diet.[16] Dietary diversity score (DDS) was calculated by classifying the foods consumed by the subjects into 5 major food groups (cereals, fish and meats, vegetables, fruits, and dairy groups) and assigning one point for each food group consumed above the minimum during the day.[15,16]
3. Statistical analysis
Complex sample analysis was performed to the national survey data using the weights, stratified variables, and cluster variables following the guidelines from the KNHANES to achieve results without biases. In order to reflect the sample design information of non-respondents of specific survey variables without missing, the standard error of the estimate was not underestimated by processing the missing value as a valid value in the analysis of the complex sample. The mean and SD were calculated using SPSS software program version 18.0 (SPSS Inc., Chicago, IL, USA). All data were reported as mean±SD or as percentages. Groups comparisons used χ2 tests for qualitative variables and independent t-test for quantitative variables. Multiple logistic regression analyses were used to measure the association between the tertiles of food intake amount and the presence of sarcopenia and was performed to compute the odds ratios (ORs) and 95% confidence intervals (Cis). All P-values of less than 0.05 were considered to indicate statistical significance.
RESULTS
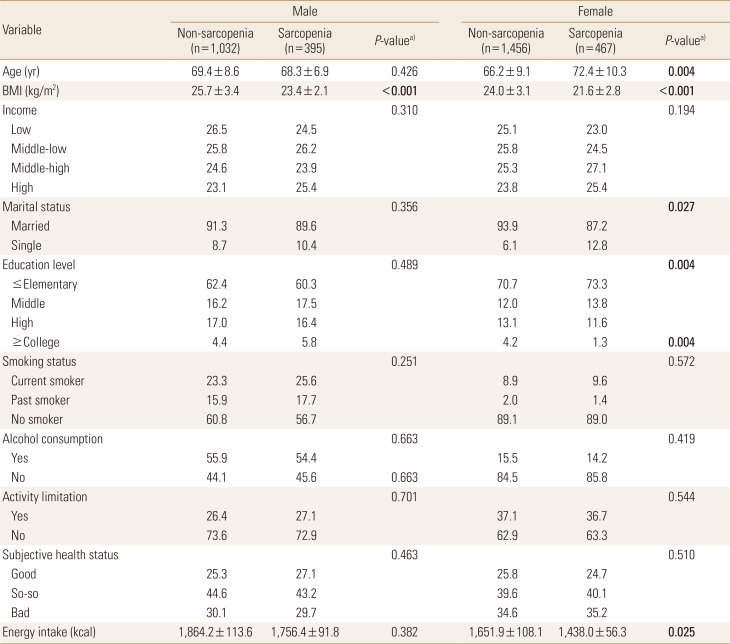
1. Demographic factors and lifestyle of the subjects
The proportion of sarcopenia was 27.7% for males and 24.3% for females. However, although not mentioned in the Table 1. In the BMI, the sarcopenia group was significantly lower than the non-sarcopenia group. There were no significant variables among males, but females showed a significant difference according to the marital status, education level, and energy intake (Table 1).
2. Dietary variety status and food intakes from each food group of the subject
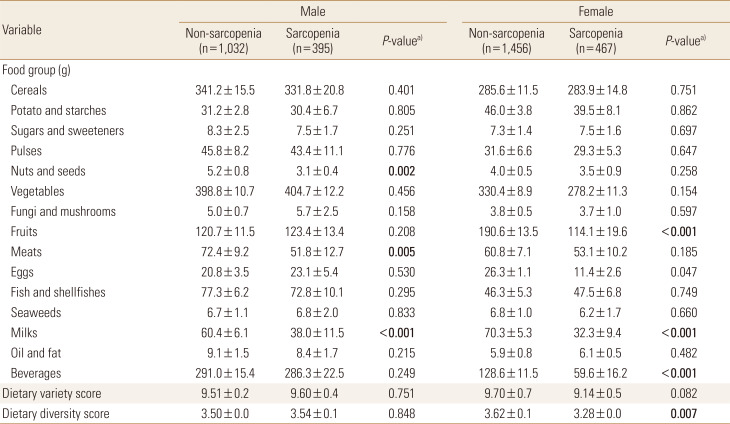
Among the 15 food groups, the sarcopenia group had significantly lower intakes of nuts and seeds, meats, and milks than the non-sarcopenia group in males. The females had significantly lower intake of fruits, milks, and beverages in non-sarcopenia group. The DVS and DDS were not significantly different between non-sarcopenia and sarcopenia in males, but DDS was significantly lower in sarcopenia than non-sarcopenia group (Table 2).
3. Multivariate analysis for associations between sarcopenia and food intake status
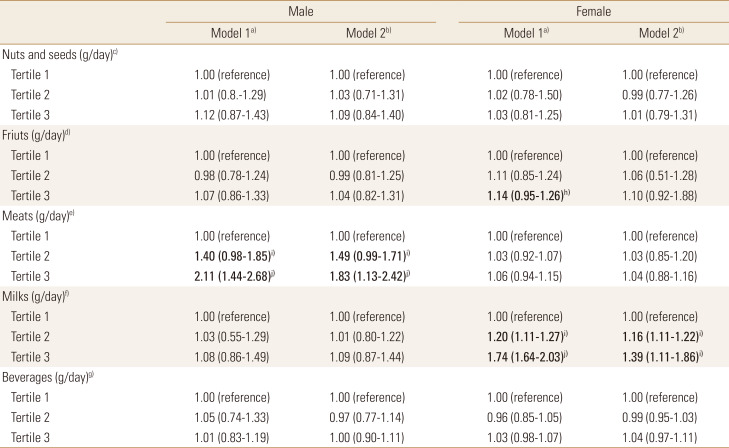
Logistic regression analyses were designed to figure out the prevalence of sarcopenia according to the tertiles of food group intakes. In case of meats intake of males, subjects in the lowest tertile (<31.1 g) had a 2.11 times (95% CI, 1.44-2.68) risk for sarcopenia, compared with those in the highest tertile (≥55.3 g) in the crude model. After further multiple adjustment for age, BMI, marital status, educational level, and energy intake factors, the ORs were remained statistically significant (tertile 3: OR, 1.83, 95% CI, 1.13-2.42 compared with tertile 1). In case of milks intake of females, the risk for sarcopenia increased 1.74 times (95% CI, 1.64-2.03) in subjects with the lowest tertile of milks intake (<30.1 g) compared with the highest tertile (≥51.9 g). After adjustment for the same factors in modelling males previously, the ORs were attenuated but remained significant (tertile 3: OR, 1.39, 95% CI, 1.11-1.86 compared with tertile 1) (Table 3).
DISCUSSION
We was identified food factors affecting sarcopenia in this study. The skeletal muscle mass is the main organ of the body's energy and oxygen consumption and keeps physical movement and posture smooth. It also serves as the main reservoir of nutrients such as amino acids and glucose. Therefore, retention of the skeletal muscle mass is in a close connection with constancy of energy metabolism and health maintenance.[17,18] Furthermore, studies focused on high loss subjects such as diabetes, cancer, elderly patients report that suitable maintenance of skeletal muscle mass improves response of medical treatment, quality of life and reduces mortality rate.[19,20] The skeletal muscle mass between men and women is somewhat different in each studies. In one longitudinal research that tracked Japanese elderly people for 12 years, the women's loss of skeletal muscle mass was higher than men's.[21] According to Davidson et al. [22] the decrease rate was nearly twice higher in men than women for healthy adults. In this study, male's skeletal muscle mass loss was slightly higher.
In the results about diversity of food intake, male's intake of nuts and seeds, milks, and meats was slightly lower in sarcopenia group. In females, fruits, milks, and beverages intake was low, and DDS was also slightly low. Low food variety of elderly people was reported: 35.2%, 59.3%, and 22.4% of subjects consumed no dairy products, fruits, and vegetables, respectively.[23] A cross-sectional study found that in women, a higher fruit and vegetable variety score was associated with higher mid-arm muscle area.[24] Therefore, a screening test that assess food variety in elderly people was recommended to be incorporated at a primary care level to identify older adults most at risk of a poor quality diet.[23] In Foote et al. [25] the quality and appropriateness of nutrition intake gets lower as the older the elderly is. It also stressed the importance of calcium and vitamin D intake considering osteoporosis and bone fractures commonly happening in older people.[25] The Kumagai and colleague [26] proposed that the total food score of the elderly would have lower risk of reduction in high strength body function, and the reduction of diversity of food intake would make high risk of sarcopenia. Muscle mass was also said to be related to dietary pattern. Mediterranean diet which consume vitamin C, selenium, and magnesium could influence muscle health, and it was reported that this can be different by race and nations' food culture.[27] For muscle mass increasing, enough nutrition support from diet is most important, however it is also necessary to intake rich protein that has full essential amino acid and calcium which is needed for synthesizing myoprotein.[28] This study also shows that major foods which contains nutrients that affect muscle mass showed deficient result in sarcopenia group. In addition, in multiple regression analysis that adjusted many factors showed proper intake of meat in males and sufficient intake of milk in females significantly reduces the risk ratio of sarcopenia. Therefore, it seems to be essential to improve quality of food through diverse and sufficient food intake to prevent sarcopenia. In the elderly, it is necessary to distinguish male and female food that each needs special attention.
This study has several limitations. As it is domestic cross-sectional study, it can't explain cause-effect relationship of sarcopenia and the result of food intake state. It is difficult to reflect individual's usual dietary intake state since dietary assessment method was measured by 24-hr dietary intake data. In addition, for accurate diagnose of sarcopenia, the classification of subjects should be carried out through new classification using muscle function and a complementary research is required since accuracy may be reduce in limited number of samples.
CONCLUSIONS
To sum up this research, there was a difference in male and female's intake of food groups depending whether they had sarcopenia in Korean elderly. Both male and female who have sarcopenia had lack intake in milks, and DDS of female with sarcopenia was lowest. It was confirmed that meat intake in male and milk intake in female had an significant correlation on sarcopenia development. For the elderly, nutritional education and management are necessary to maintain a balanced nutrition status through the proper food choice and intake. We expect that it can be used as a basis for preparing dietary guidelines to prevent sarcopenia in elderly people.
 PDF Links
 PubReader
 ePub Link
 Full text via DOI
 Full text via PMC
 Download Citation
 Print
Print