


INTRODUCTION
Metabolic syndrome (MetS) is defined by increased blood pressure, high blood sugar, and abnormal levels of other metabolic markers that collectively increase the risk of chronic diseases such as cardiovascular disease and diabetes.[1,2,3] Dietary factors, such as high cholesterol and fat content, induces MetS. Milk, fruits, and vegetables have been reported to prevent MetS.[4] In addition, vitamin D deficiency has been recently recognized as an important contributing factor and is emerging as a worldwide nutritional problem. The best biomarker of vitamin D status is serum 25-hydroxy-vitamin D (25[OH]D), which represents the metabolic state of calcium and the bone and is inversely correlated with body fat mass, blood glucose control, lipid metabolism, and blood pressure.[5,6] Previous studies have shown that the higher the serum 25(OH)D level, the lower the risk of MetS.[7,8] In addition, serum 25(OH)D levels and insulin resistance were inversely correlated in overweight and obese adults.[9] However, a study of elderly people aged ≥65 years showed that serum 25(OH)D levels and MetS are not associated, and this relationship remains controversial.[10]
Among the metabolic-syndrome-related diseases, nonalcoholic fatty liver disease alone is known as a strong predictor of MetS.[11] The amount of fat accumulated in the liver has been reportedly related to the factors associated with MetS and is more than four times higher in people with MetS.[12] Fat accumulation in the liver is primarily due to the inflow of fatty acids into the liver, which in turn increases the amount of fat mass from fat tissues due to insulin resistance. Liver fat accumulation and insulin resistance form a vicious cycle in which the causes and effects can be repeated. The expression of genes encoding enzymes that regulate vitamin D levels in adipocytes has been a focus to understand the association between obesity and vitamin D.[13] The increase in body fat is known to decrease the vitamin D metabolism due to the increase of vitamin D decomposition effect and the decrease of the activating enzyme, and it has a negative effect on the vitamin D synthesis due to the lowered liver function such as non-alcoholic fatty liver.[14]
The relationship between vitamin D and MetS has been studied in various age groups and disease groups. However, there is a lack of vitamin D studies in patients with fatty liver in Korea, and studies on the relationship between vitamin D levels and MetS have been rarely conducted. Also, the proportion of insufficient vitamin D defined as a serum 25(OH)D level of <50 nmol/L, was 47.3% and 64.5% in Korean males and females, respectively.[15] The aim of this retrospective study was to investigate the effect of vitamin D status on the risk of MetS in nonalcoholic fatty liver.
METHODS
1. Study subject
Patients diagnosed with simple fatty acid and nonalcoholic fatty liver by ultrasonography were selected. Patients who were positive for hepatitis antigens, consumed ≥40 g of alcohol per week, had a secondary infection, were undergoing osteoporosis treatment, and with a diagnosis of chronic diseases, such as diabetes, hypertension, and hyperlipidemia, were excluded. A total of 183 individuals were recruited; however, the final analysis was conducted with 151 patients, excluding those who rejected the survey and were not eligible. Participants were fully informed about the purpose, necessity, and method of this study. The subject's recruitment and data analysis of this survey was conducted from March 2013 to February 2014. We obtained the institutional review board approval from Soonchunhyang University on the design and progress of the overall research.
2. Variable measurements and definitions
The age and sex of the subjects were checked, and calcium and vitamin D supplements were examined. Current smokers are participants who have been smoking for more than 6 months. Regular physical activity was defined as walking, cycling, swimming, and exercising for more than three times a week, 30 min/1 time. Anthropometric measurements accurately measure the height and weight, and body mass index (BMI) was also calculated. The waist circumference was measured in the upright position using the tape measure between the lower part of the lowest rib and the middle part of the pelvic iliac crest. Systolic and diastolic blood pressures were measured using a sphygmomanometer. Blood tests confirmed the results in the medical records. Blood samples collected after 12 hr fasting were measured using an automatic analyzer (Automatic Analyzer Hitachi 747; Hitachi Medical Corp., Hitachi, Japan), and the total cholesterol, low-density lipoprotein (LDL) cholesterol, high-density lipoprotein (HDL) cholesterol, triglyceride, and fasting blood glucose (FBG) levels were obtained. The MetS was diagnosed based on the criteria of the National Cholesterol Education Program (NCEP)-Adult Treatment Panel (ATP III) using abdominal obesity (males, ≥90 cm; females, ≥80 cm).[16] To assess vitamin D status, serum 25(OH)D3 was measured using a chemiluminescent immunoassay (Liaison, DiaSorin, Italy), and blood was collected at the time of study consent for accurate analysis of vitamin D. We classified into three groups according to the results of vitamin D concentration.[17]
3. Statistical analysis
All statistical analyses were performed using SPSS (version 18.0; SPSS Inc., Chicago, IL, USA). Data were reported as mean±standard deviation or as numbers and percentages. The χ2 and Kruskal-Wallis tests were used to determine the significant differences among the three groups. Independent t-test was used to determine various clinical characteristics. Odds ratios (ORs) were calculated using multinomial logistic regression to estimate the association between 25(OH)D and various factors. Adjusted ORs were derived after adjusting the covariates. The proportional changes and 95% confidence intervals (CIs) were calculated using the exponentiation of the coefficients, which means that the proportional changes in the arithmetic mean were associated with each level of covariate relative to a reference level. All results were considered statistically significant when P<0.05.
RESULTS
1. Demographic factors and serum 25(OH)D concentration of the participants
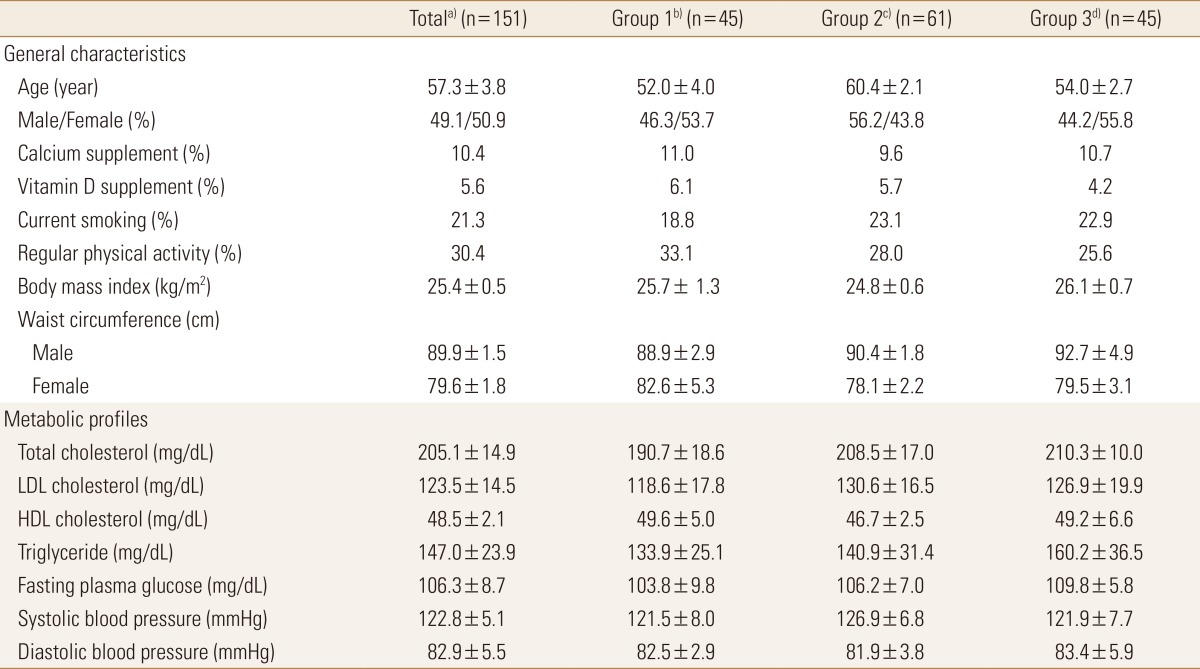
The mean serum 25(OH)D concentration of 151 subjects was 14 ng/mL: 45 in the Group 1 (≥20 ng/mL), 61 in the Group 2 (12-19 ng/mL), and 45 in the Group 3 (<12 ng/mL) groups according to the criteria of previous study.[18] The average age was 57.3 years, and male to female ratio was 49:51. The mean BMI was 25.4±0.5 kg/m2, and obesity rates of all three groups were BMI of >25 kg/m2. The average waist circumference was 89.9±1.5 cm in males and 79.6±1.8 cm in females. The waist circumference increased as the serum 25(OH)D concentration decreased in men. When considering the blood lipid status, the mean total, LDL, and HDL cholesterol and triglyceride results are within the normal range. The mean FBG level was 106.3±8.7 mg/dL, which was higher than the MetS standard (100 mg/dL). The average current smoking and regular exercise rates were 21.3% and 30.4%, respectively, and the regular exercise rate was low in the low serum 25(OH)D concentration group. However, the baseline characteristic data showed no significant difference based on the serum 25(OH)D concentration (Table 1).
2. Comparison of various characteristic factors according to MetS
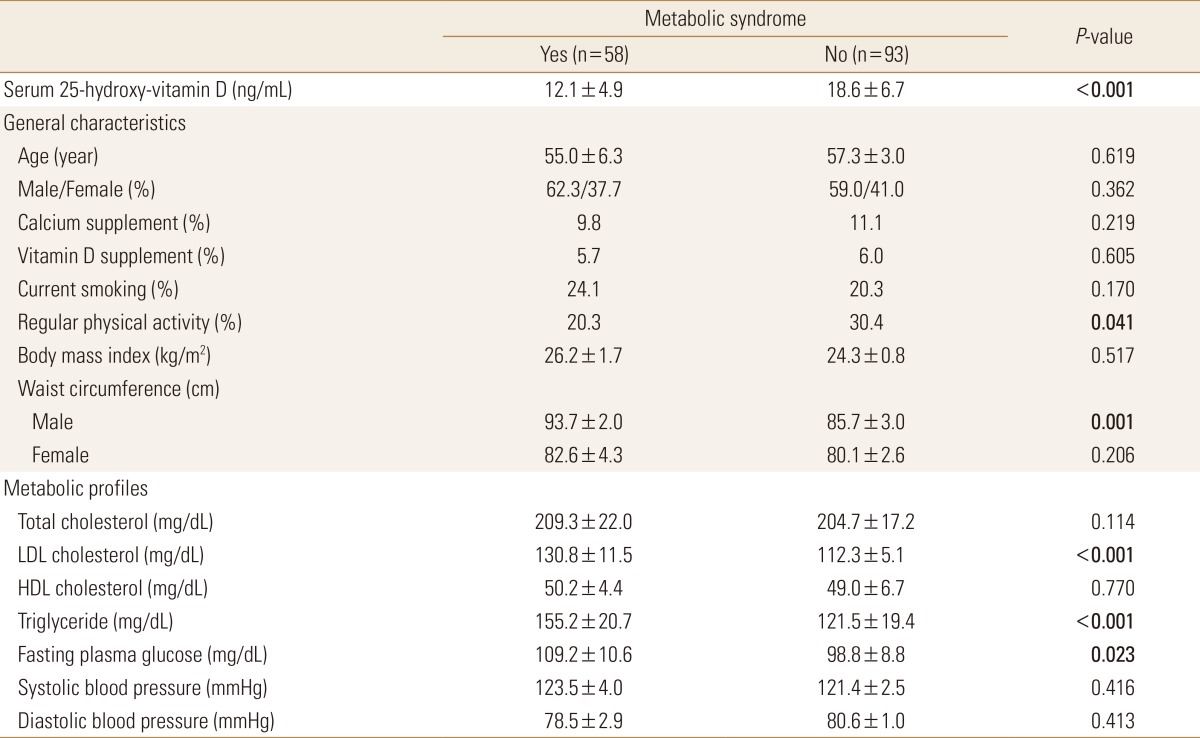
When classifying all the subjects according to the MetS criteria, 38.4% (n=58) of the MetS group were included. When comparing the 25(OH)D levels between the two groups, the MetS and normal groups had 12.1±4.9 ng/mL and 18.6±6.7 ng/mL, respectively. Among the general factors, the regular exercise rate between the two groups showed significant difference. The exercise rate was lower in the MetS group (20.3%) than in the normal group (30.4%). Metabolic profiles showed that waist circumference and LDL cholesterol, triglyceride, and FBG levels in males were significantly higher in the MetS group than in the normal group (Table 2).
3. Risk for MetS based on the serum level of 25(OH)D concentration
The prevalence of MetS was inversely associated with the serum level of 25(OH)D. Compared with the Group 1 group, the ORs of MetS in the Group 2 and 3 groups progressively increased to 1.70 (95% CI, 1.16-3.86) and 2.59 (95% CI, 1.25-4.31), respectively. In model 2 after adjusting for age, gender, current smoking, and regular physical activity, the ORs of MetS in the Group 2 and 3 groups significantly increased to 1.45 (95% CI, 0.87-2.24) and 2.08 (95% CI, 1.11-3.52), respectively. After adjusting for the metabolic profiles based on model 2, the ORs of MetS were 1.06 (95% CI, 0.81-1.90) and 1.47 (95% CI, 0.98-2.81) (Table 3).
DISCUSSION
This study aimed to investigate the incidence of MetS in patients with fatty liver and the difference in the risk of MetS based on vitamin D concentration. First, the average serum 25(OH)D concentration in patients with fatty liver was extremely low (14 ng/mL). Vitamin D is deficient when the blood 25(OH)D concentration is <12 ng/mL; insufficient, 12 to 20 ng/mL; and sufficient, >20 ng/mL.[18] Considering these standard values, 40.4% and 29.8% of the study subjects had insufficient and deficient blood 25(OH)D concentrations, which contributes to the vulnerability of vitamin D status. The proportion of MetS among the patients with fatty liver was 38.4%. In Korea, the relationship between MetS and vitamin D status in fatty liver patients has not been studied. Therefore, comparing accurate results is difficult. The nonalcoholic fatty liver disease was associated with MetS. Risk factor were abdominal obesity, hyperglycemia, hypertension, and dyslipidemia as each component of MetS.[19] In addition, OR of MetS in the fatty liver disease significantly increased to 3.43 compared to normal group.[20] In this study, the MetS group had a low regular physical activity rate, high waist circumference in men, and high LDL cholesterol, triglyceride, and FBG levels, which is consistent with the previous studies in other countries. Chitturi et al.[21] reported that 98% of nonalcoholic fatty liver patients had insulin resistance and 87% had MetS. This difference may be because the actual rate of association is thought to be related to the higher prevalence of obesity in Western people than in Korea. Most importantly, majority of patients with fatty liver are high risk of MetS and have a higher degree of obesity. Therefore, intensive management is required.
Considering a number of factors, the risk of MetS significantly increased as the vitamin D concentration decreased. Low vitamin D levels in Korean adult [22] or diabetic patients [23] have been associated with increased risk of MetS, and vitamin D levels in obese individuals are highly correlated with insulin resistance and MetS. Insulin resistance is the main mechanism of MetS. This is because vitamin D lowers insulin resistance by promoting the expression of insulin receptors or intracellular insulin response that begins with the influx of calcium.[24] However, a few studies are not directly relevant; therefore, further research is required.
This study has several limitations. First, this study was based on the retrospective design with the small numbers of subjects. Since it could cause the selection bias, there was an inadequate part to generalize the results. Second, the results of the analysis of dietary intake were not considered. We believe that a more comprehensive comparison is necessary between the normal control group rather than the fatty liver patients. However, we could provide basic data by analyzing various metabolic indexes for patients with fatty liver. Therefore, patients with fatty liver should be identified early to prevent chronic diseases and improve the bone-related vitamin D concentrations in patients high risk of MetS.

 PDF Links
 PubReader
 ePub Link
 Full text via DOI
 Full text via PMC
 Download Citation
 Print
Print